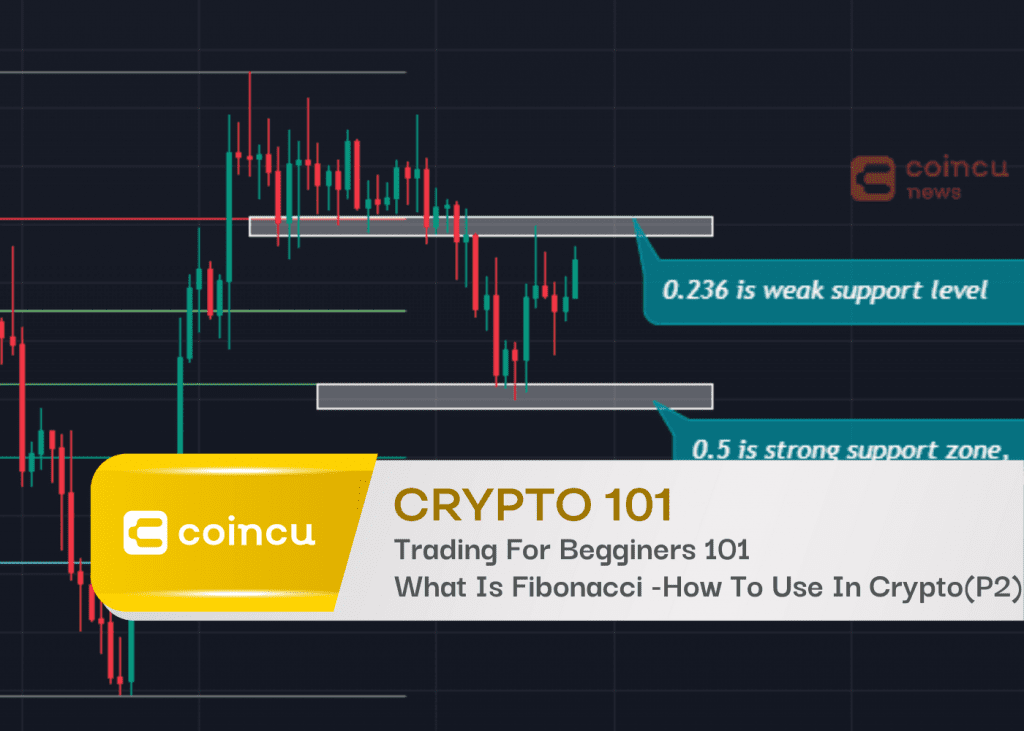
In part 1 we learned about the concept as well as the formation of Fibo, besides we also guided how to trade with Fibo Retracement. In this section, we will find another, which is the Fibo Extension. It is a universal trading concept that can be applied to all timeframes and markets. Traders often use this tool to take profits. Let’s find out the details.
What is the Fibonacci Extension?
Fibonacci Extension is drawn by joining three points, unlike Fibonacci Retracement which has just two points by joining the lowest and the highest points of a pre-defined trend and vice versa. Let’s understand how we can draw Fibonacci Extension in case of an uptrend. You need to join the lowest and the highest point and then after a retracement or a correction, the price continues in the direction of the original trend, the low of the retracement or a pullback would be our third point.
The most common Fibo extension levels are 161.8%, 261.8%, and 423.6%. Though the ratio may be a little distorted at the beginning of the sequence, as the number gets bigger, the above-proved ratio appears. Though these are quite far-off numbers, the other important resistance levels using Fibonacci extension come at 50%, 61.8%, 78.6%, and 100%. The derivation of these numbers is discussed in last week’s article on the Fibonacci retracement. When the token is trading at a lifetime high area where there is no prior resistance, you may draw probable resistance levels using the Fibonacci extension.
How to trade with Fibonacci Extension?
Case 1: Uptrend
In an uptrend, the general idea is to take profits on a long trade at a Fibonacci Price Extension Level. You determine the Fibonacci extension levels by using three mouse clicks.
- First, click on a significant Swing Low,
- Then drag your cursor and click on the most recent Swing High.
- Finally, drag your cursor back down and click on any of the retracement levels.
This will display each of the Price Extension Levels showing both the ratio and corresponding price levels. Let’s go back to that example with the ETH/USDT chart.
The 50.0% Fib level held strongly as support and, after five tests, the price returned to retest the support levels of 0.236 & 0.382 before resumed its uptrend. In the chart above, you can even see the price rise above the previous Swing High. Let’s pop on the Fibonacci extension tool to see where would have been a good place to take off some profits.
Here’s a recap of what happened after the retracement Swing Low occurred:
- Price rallied all the way to the 61.8% level, which lined up closely with the previous Swing High.
- It fell back to the 0.236 & 0.382 level, where it found support
- Price then rallied and found resistance at the 0.618 level.
- I belive a couple of hours later, the price rallied yet again before finding resistance at the 100% level.
Case 2: Downtrend
In a downtrend, the general idea is to take profits on a short trade at a Fibonacci extension level since the market often finds support at these levels. Let’s take another look at that downtrend on the 1-hour EUR/USD chart we showed you in the Fib Sticks lesson
Let’s take another look at that downtrend on the 4-hour ETH/USDT chart. Ba điểm chú ý là đỉnh $1925, đáy $905 và đỉnh hồi lại $1286. We will make an short order at top return.
The price has clearly touched and has a little rest at the Fib Ext zones of 0.236. These are the profit taking areas for the above sell order. We could have taken off profits at the 38.2%, 50.0%, or 61.8% levels. All these levels acted as support, possibly because other traders were keeping an eye out for these levels for profit-taking as well.
The examples illustrate that price finds at least some temporary support or resistance at the Fibonacci extension levels – not always, but often enough to correctly adjust your position to take profits and manage your risk. Of course, there are some problems to deal with here.
There is no way to know which exact Fibonacci extension level will provide resistance.
ANY of these levels may or may not act as support or resistance. Another problem is determining which Swing Low to start from in creating the Fibonacci extension levels. One way is from the last Swing Low as we did in the examples; another is from the lowest Swing Low of the past 30 bars.Again, the point is that there is no one right way to do it, but with a lot of practice, you’ll make better decisions of picking Swing points.
You will have to use your discretion in using the Fibonacci extension tool. You will have to judge how much longer the trend will continue. Later on, we will teach you methods to help you determine the strength of a trend.
Verdict
Some Fibonacci retracement levels that you need to be interested in are 23.6%, 38.2%,50%, 61.8%, 76.8%. The most important levels are 38.2, 50 and 61.8. These levels are usually the default levels in trading platforms. Traders use Fibonacci retracement levels as potential areas of support and resistance. The Fibonacci Extension levels are 38.2%, 50%, 61.8%, 100%, 138.2% and 161.8% Traders use Fibonacci extensions as support and resistance areas to set profit. To use Fibonacci on a chart, you need to find the highest and the lowest. To use Fibonacci effectively, it can be combined with support – resistance, trend lines and candlestick patterns for finding entry and stop loss.
If you have any questions, comments, suggestions, or ideas about the project, please email ventures@coincu.com.
DISCLAIMER: The Information on this website is provided as general market commentary, and does not constitute investment advice. We encourage you to do your own research before investing.
Alan
Coincu Ventures


