Key Points:
A variety of on-chain indicators point to Bitcoin being at or near the bottom of its cycle. The most significant is the impact of the halving event, as it has been in prior cycles.
The Bitcoin halving algorithm automatically reduces the block reward by half every four years. The next one is scheduled for May 2024, when the block reward will be reduced to 3.125 BTC.
According to Rekt Capital, Bitcoin has historically bottomed 517-547 days before the next halving occurrence. This means that markets could be very close to their cycle bottom if history rhymes.
Other technical indicators are displaying cycle bottom signs as well. According to PlanB, the originator of the stock-to-flow methodology, the Bitcoin Relative Strength Index (RSI) is at its lowest point in history (RSI 40.5).
The RSI is a momentum indicator that measures the speed and amplitude of recent price fluctuations in an asset. Furthermore, it is utilized to assess overpriced or undervalued market circumstances, which are currently exceedingly poor.
Miles Deutscher, a crypto expert, stated that a Bitcoin wick down to $10,000 might not be that horrible because it is tradable.
Max pain isn’t a BTC wick down to $10k, or ETH to $500. At least you can trade volatility. It’s actually a prolonged, boring, sideways crab market where alts slowly bleed vs BTC and volume dries up.
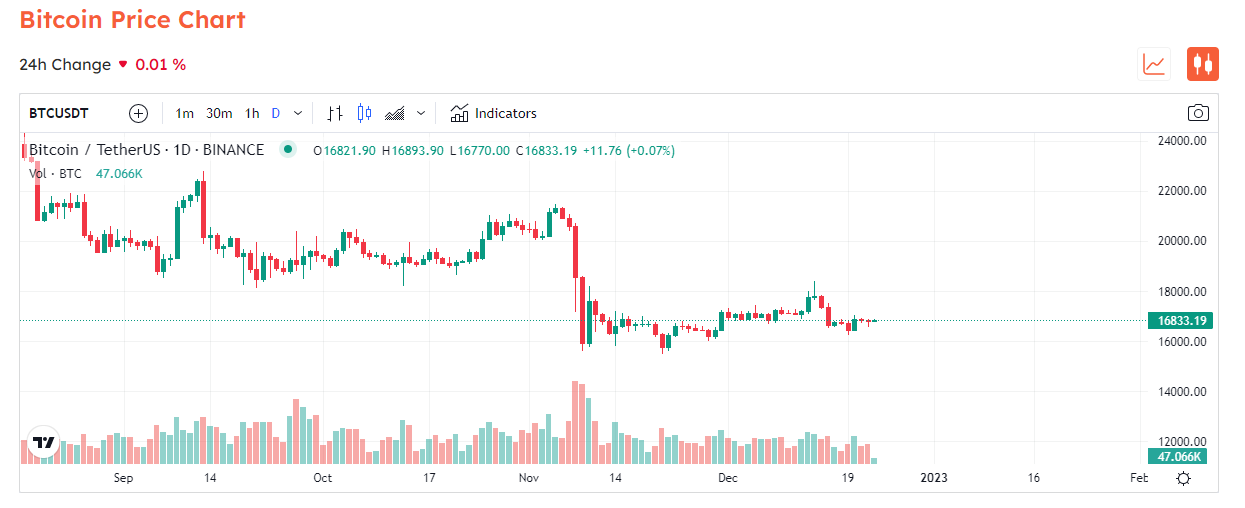
Bitcoin prices have been stable since a week ago when they were slightly around $17,000. According to Coincu, there has been almost no movement (0.01%) in the previous 24 hours, and the asset was changing hands for $16,831 at the time of writing.
BTC prices have not yet recovered to their November 22 cycle low of roughly $15,720, but they are close. Bitcoin is presently down 75.6% from its all-time high set in November 2021.
DISCLAIMER: The Information on this website is provided as general market commentary and does not constitute investment advice. We encourage you to do your own research before investing.
Join us to keep track of news: https://linktr.ee/coincu
Website: coincu.com
Thana
Coincu News
London, UK, May 10th, 2024, ChainwireKintsu, a leading innovator in the DeFi space, is thrilled…
KuCoin resumes operations in India after paying a $41,000 penalty, while Binance registration in India…
Telegram trading bots represent a growing trend in cryptocurrency trading, offering both publicly and privately…
Notable contenders leading the charge in Ethereum ETF applications include VanEck, BlackRock, and ARK Invest,…
Nyan Heroes Airdrop has become a trending topic, hailed as the hottest AAA shooter game…
Slow Mist founder exposes TON phishing messages, which users tricked into believing they receive cheap…
This website uses cookies.