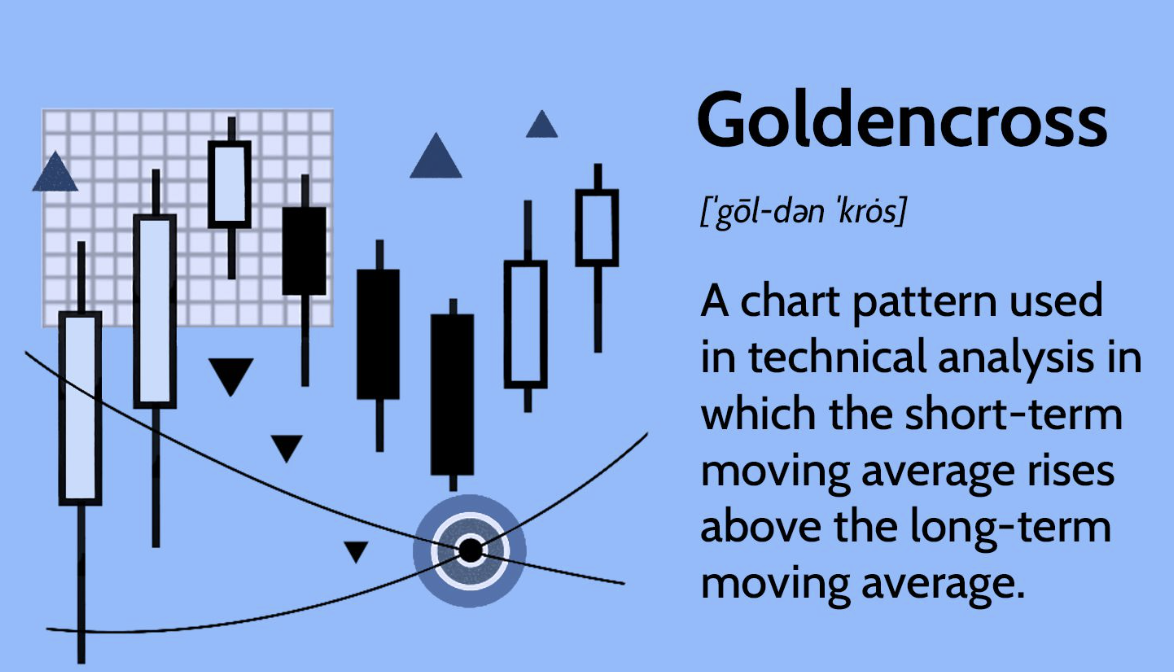
A golden cross is a technical analysis chart pattern that signals a potential bullish breakout in the market. It occurs when a security’s short-term moving average crosses above its long-term moving average.
The short-term moving average, such as the 15-day moving average, is a representation of the stock’s recent performance, while the long-term moving average, such as the 50-day moving average, represents its historical performance. This chart pattern is significant as long-term indicators carry more weight in the market, and a GC indicates that the stock is likely to continue to rise in the future. Additionally, high trading volumes reinforce the validity of the GC. Therefore, investors often use it as a signal to purchase a stock and hold it for the long term, expecting significant returns.
A golden cross refers to a bullish signal that occurs when a short-term moving average of an asset’s price crosses above a long-term moving average. It is typically observed on price charts and is considered a positive indicator for the asset’s future price movement.
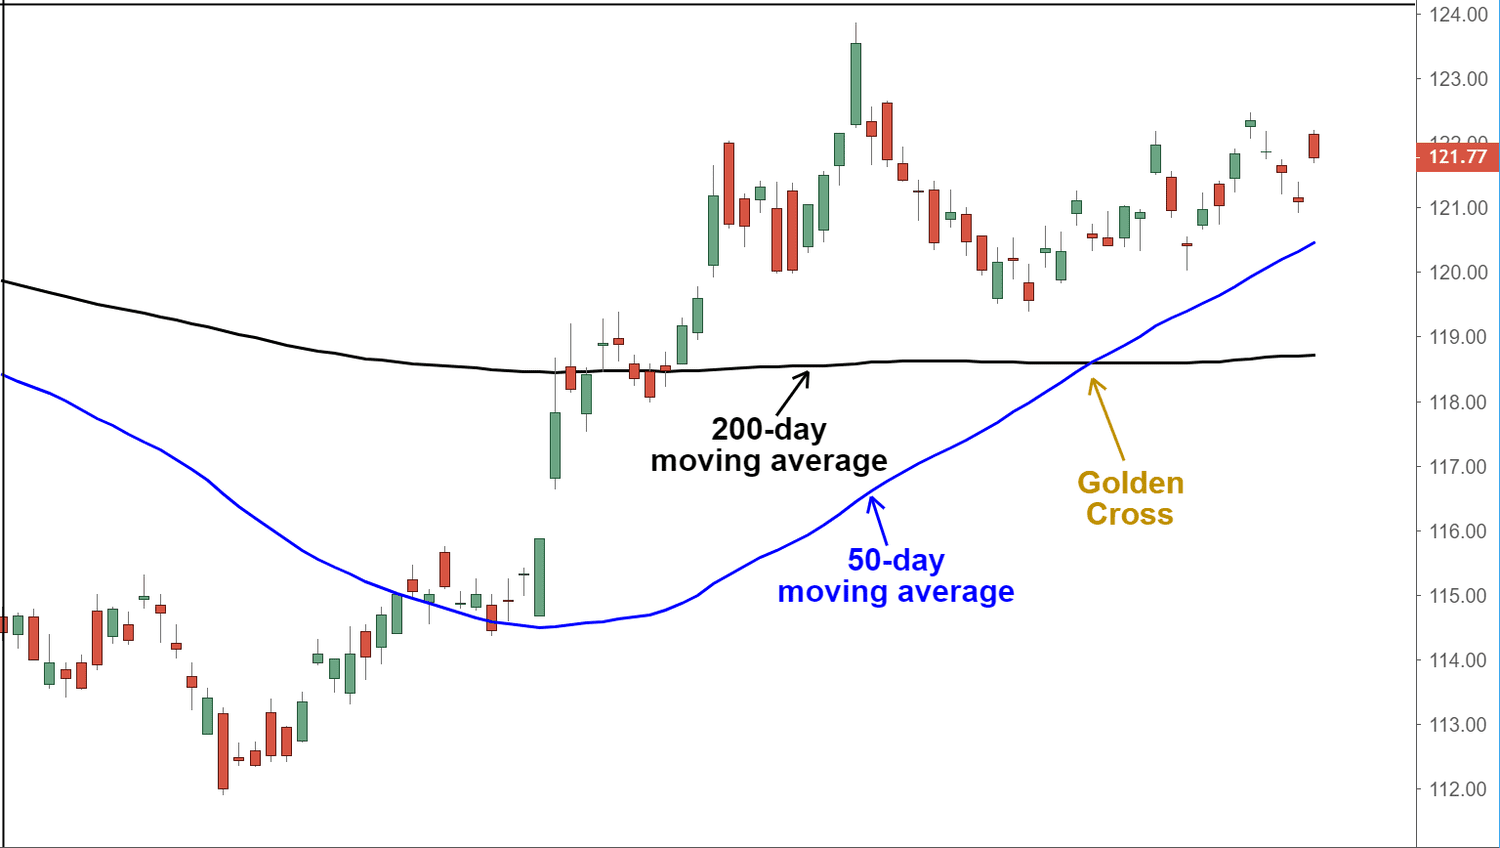
The GC involves two moving averages: the shorter-term moving average and the longer-term moving average. The most commonly used moving averages are the 50-day moving average (short-term) and the 200-day moving average (long-term). When the shorter-term moving average crosses above the longer-term moving average, it forms a golden cross pattern.
The GC is seen as a significant event by technical analysts and traders because it suggests a shift in market sentiment from bearish to bullish. It indicates that the asset’s recent price momentum is gaining strength and that the uptrend might continue in the future. Traders often interpret the golden cross as a signal to enter long positions or as confirmation of an existing bullish trend.
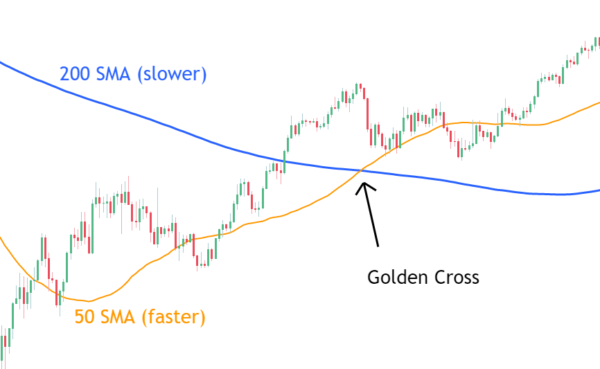
The golden cross is a popular technical analysis indicator used by traders to identify bullish market signals. This trend reversal pattern is characterized by a crossover between two moving averages, with the shorter-term moving average crossing above the longer-term moving average.
The golden cross can be broken down into three stages, with each stage indicating a different aspect of the trend reversal. The first stage requires that a downtrend eventually bottoms out as selling is depleted. This stage can take a considerable amount of time as the market tries to find a bottom. The second stage is where the trend reversal begins, as the shorter moving average forms a crossover up through the larger moving average, triggering a breakout and confirmation of the trend reversal. This second stage is crucial as it marks the beginning of the uptrend. During the last stage, the trend continues upward, resulting in higher prices. It is worth noting that during this stage, the moving averages can act as support levels on pullbacks, helping to sustain the trend.
While the most commonly used moving averages are the 50-period and the 200-period moving average, other time increments can be used as well. Generally, larger time periods tend to form stronger and lasting breakouts. For example, the daily 50-day moving average crossover up through the 200-day moving average on an index like the S&P 500 is one of the most popular bullish market signals.
The golden cross is not only applicable to popular indexes like the S&P 500 but also to bellwether indexes. A bellwether index is an index that is used to gauge the performance of a particular industry or sector. When a golden cross forms on a bellwether index, the buying resonates throughout the index components and sectors, leading to a rise in prices.
Day traders commonly use smaller time periods like the 5-period and 15-period moving averages to trade intra-day golden cross breakouts. The time interval of the charts can also be adjusted from 1 minute to weeks or months. Just as larger periods make for stronger signals, the same applies to chart time periods as well. The larger the chart time frame, the stronger the golden cross breakout tends to be.
The golden cross is a powerful trend reversal pattern that can be used by traders to identify bullish market signals. By understanding the different stages of the golden cross and the different time periods used to determine it, traders can better position themselves to profit from the trend reversal. With its ability to apply to a wide range of indexes and sectors, the golden cross is a valuable tool for any trader looking to identify profitable market trends.
To spot a golden cross, you need to observe the price chart of an asset and identify the crossing of the short-term moving average above the long-term moving average. Here are the steps to help you spot a golden cross:
Golden crosses, like any technical analysis indicator, are not infallible, but they can provide valuable insights into market trends. Here are some factors to consider regarding the reliability of golden crosses:
A bullish reversal is a signal to technical traders that can be identified by a GC. When this happens, or is about to happen, traders commonly close their short positions and become more optimistic.
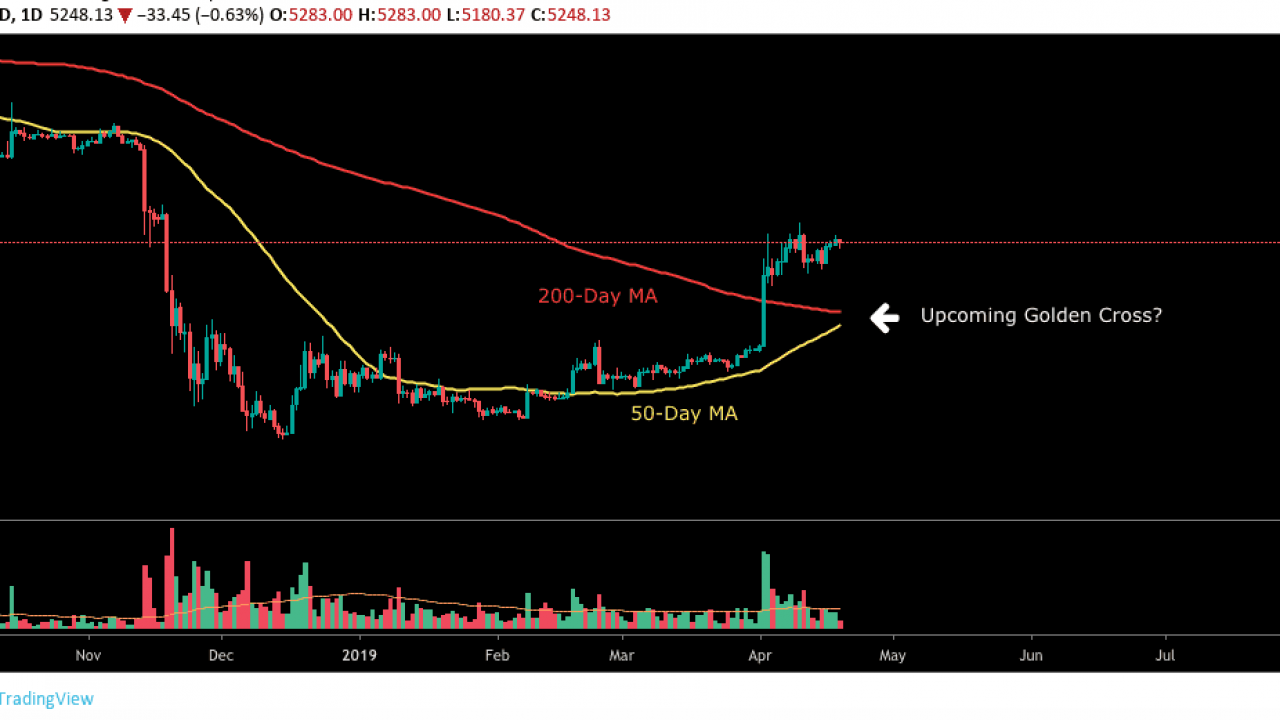
Golden crosses tend to be more reliable indicators in less volatile market conditions. In choppy markets where prices spike and plunge on a regular basis without sustained price movement in either direction, the 50-day MA and the 200-day MA may move above and below each other many times over days and weeks. This type of market can make it difficult to identify a GC, but if you are able to identify it, it can provide valuable information.
When a GC occurs, it’s important to ask yourself why this chart action is happening. Is the 50-day MA indicative of sustained cryptoasset-specific buying activity that is the primary driver of a golden cross’ predictive use? Or is the cryptoasset’s price following a larger market trend as high volatility sends many other cryptoassets on a similarly chaotic ride? This context is important in order to understand the significance of the golden cross.
The larger market context and the chart duration of a golden cross both matter. A golden cross that takes months to form and is confirmed with strong follow-through buying provides meaningful long-term information to a trader that GC patterns formed over shorter periods cannot. Understanding the context around a golden cross can help you make more informed trading decisions.
As with all technical indicators, a golden cross is a statistical chart representation that depicts ongoing decision-making by buyers and sellers. It can provide insight into an asset’s current market dynamics and how they may be evolving – information that can help you decide how to trade. By taking the time to analyze the context and duration of a golden cross, you can make more informed trading decisions and potentially increase your profits.
Golden crosses can be valuable indicators in technical analysis for identifying potential bullish trends. While they are not foolproof and should be used in conjunction with other analysis tools, golden crosses can provide insights into market sentiment and upward momentum.
Traders should consider the confirmation of a golden cross through additional indicators and analysis techniques, such as volume, momentum indicators, and market context. Evaluating the overall market conditions, timeframe, and potential false signals is crucial in interpreting the reliability of a golden cross.
DISCLAIMER: The Information on this website is provided as general market commentary and does not constitute investment advice. We encourage you to do your own research before investing.
Join us to keep track of news: https://linktr.ee/coincu
Annie
Coincu News
Kraken may drop USDT in the EU due to upcoming MiCA regulations. Other exchanges adapt,…
Rumor has it that zkSync, an Ethereum scaling solution, may drop a governance token soon.…
Oklahoma crypto bill OKHB3594 safeguards residents' rights to use and self-custody digital assets, legalizes home…
Solana tops CoinGecko, boasting highest daily transactions per second (TPS). It outperforms Ethereum and Polygon,…
Bitcoin's correlation with mainstream assets, like tech stocks, is on the rise, fueled by optimism…
The Federal High Court in Abuja has denied bail to Tigran Gambaryan, a senior Binance…
This website uses cookies.