
ETH on-chain activity is cooling amid macro uncertainty.
Investor concerns about the impact of Federal Reserve (Fed) monetary policy changes on US financial markets influenced the crypto market over the past 2 months. In particular, the price of crypto is moving closer to riskier assets like tech stocks. The correlation between growth/tech stocks and Bitcoin, ETH is currently high, but historically ETH has been more strongly correlated with growth/tech than Bitcoin.
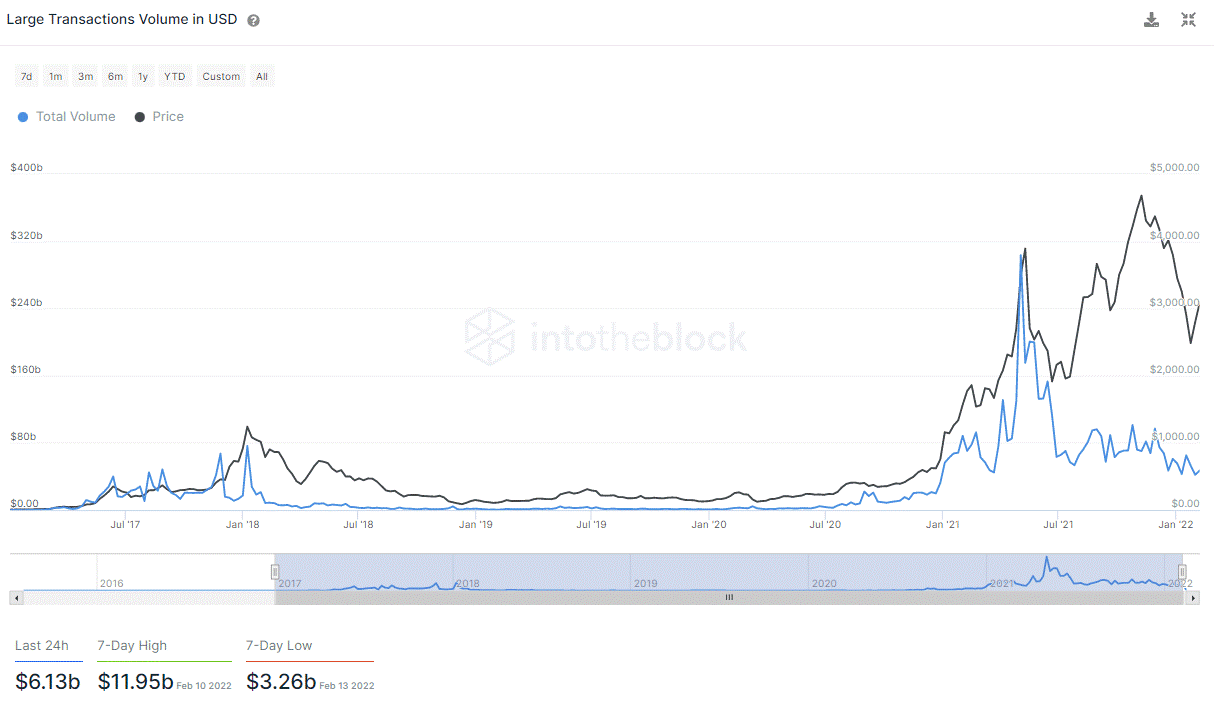
The falling price appears to have quenched much of the speculative activity that typically drives crypto markets, and some on-chain activity has also declined. Most of the trading volume is done by institutions, which is reflected in the high transaction volume. This week, daily transactions on the Ethereum blockchain ranged from $3 billion to $6 billion, while last summer’s all-time high was $300 billion.


Large trading volume from February 15 | The source: Into the block
Large transactions are those that transfer amounts greater than $100,000. In this case, the Volume (in dollars) indicator measures the total amount of dollars transferred on these trades. Therefore, the decline in trading volume is due to the current unstable macro situation.
This drop also has a negative impact on the fees generated by the blockchain. The indicator is useful for monitoring transaction demand levels on the Ethereum blockchain. As bull markets increase demand and speculation, average transaction fees tend to become more expensive during these periods.
After the price has increased significantly, the average transaction fee tends to keep rising as traders rush to take profits. As can be seen in the chart, the average fee for a transaction is currently around $30, down 40% from the fall 2021 all-time high of $50.
Average transaction fee on February 15 | The source: Into the block
Regardless of whether these two indicators reflect a cooling market, the total number of addresses with a balance showing interest in holding and investing in ETH continues to rise. Overall, the number of addresses with increased balances is positive as it signals a growing and stronger user base.
While the total number of addresses with a balance doesn’t exactly match the number of holders, it does provide a valuable estimate of the number of crypto holders. There are cases where a single user can have multiple addresses, but there are also cases where one address can contain multiple users’ funds (centralized exchange).
Refer to the table below, the total number of addresses with a balance is now more than 70 million addresses. The index has not fallen since last summer and has been growing by about 10 million people every three months since 2017.
Total addresses as of February 15 | Source: IntotheBlock.
Overall, Ethereum usage is subject to change based on market conditions and increasing speculation, but it is important that the adoption rate continues to increase on a daily basis, as we have seen. Many users participate simply by holding ETH in their wallets or using decentralized finance applications that the smart contract blockchain enables. To date, this usage has continued despite volatile or bearish macro conditions.
Join CoinCu Telegram to keep track of news: https://t.me/coincunews
You won’t believe which twenty U.S. states are racing to secure "Strategic Bitcoin Reserve" bills,…
With its presale performance already boasting over $5 million raised and 62 billion BTFD coins…
Delve into BlockDAG's unlimited 6-10% USDT cashback program. Get the latest on TRON market analysis…
Solayer, the innovative re-staking platform for the Solana network, has officially released its highly anticipated…
Babylon is excited to announce the launch of the Babylon Phase 2 testnet on Wednesday,…
Discover why BTFD Coin, Dogecoin, and Degen are the best new meme coins to invest…
This website uses cookies.