Last week, the Ethereum price experienced a notable recovery, pausing the downward trend that has persisted since April. Technical analysis from the daily timeframe showed signals suggesting that the ETH price will touch $2000.
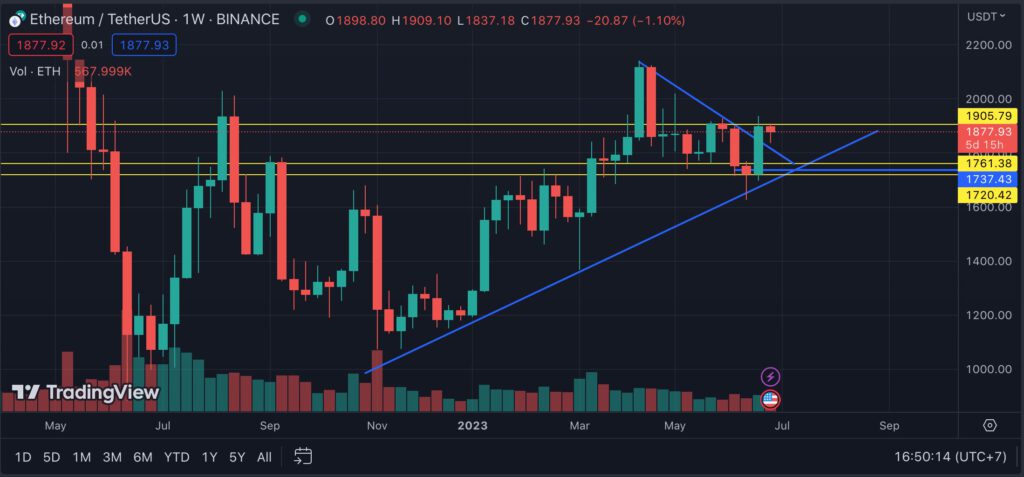
The ETH price is currently consolidating within a range formed by horizontal support and resistance, specifically between $1650 and $1950. Considering the short-term pattern and current price action, it is likely that the ETH price will continue to move toward the upper end of this range and eventually experience a breakthrough.
The Ethereum price is close to reaching a yearly high
ETH, the original token of the Ethereum blockchain, was created by Vitalik Buterin. Technical analysis from the weekly timeframe for the Ethereum price shows some signals for a bullish trend. This is due to conflicting signals from both technical indicators and price action.
In early April, it seemed like the Ethereum price had surpassed the resistance level of $1950. However, this breakthrough was unsuccessful. The Ethereum price dropped the following week and has continued to decline since then (represented by the red circle).
Two weeks ago, the Ethereum price touched the support area at $1622 but then rebounded (represented by the green symbol), confirming the $1650 area as a support level. Currently, ETH is trading within a price range of $1650 to $1950.

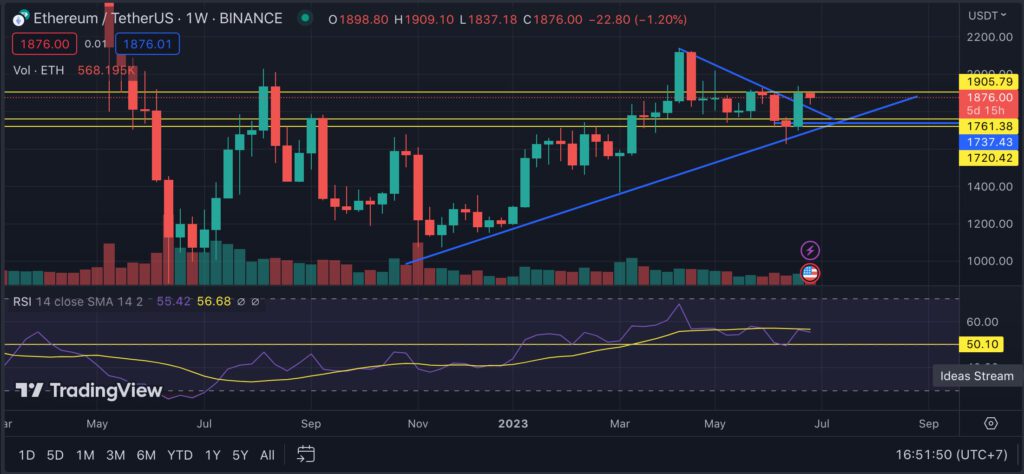
RSI over 50 in a weekly timeframe
The Relative Strength Index (RSI) is a valuable tool utilized by traders to assess market conditions and support recovery. Currently, Ethereum (ETH) is at a critical level with the RSI value being over 50 and trending upwards, indicating a favorable position for buyers. When ETH rises, the RSI also rises at the 50 lines (marked by a green circle), signaling an upward trend.
However, it is essential to note that the RSI is still very close to the 50 level. Therefore, there is still a possibility that this value may decrease below 50, indicating a potential market decline. The RSI tool is a commonly used and widely respected indicator in the trading world and can be useful for those looking to assess market trends and predict future price movements.

The Ethereum price prediction: Elliott wave model predicts new yearly high!
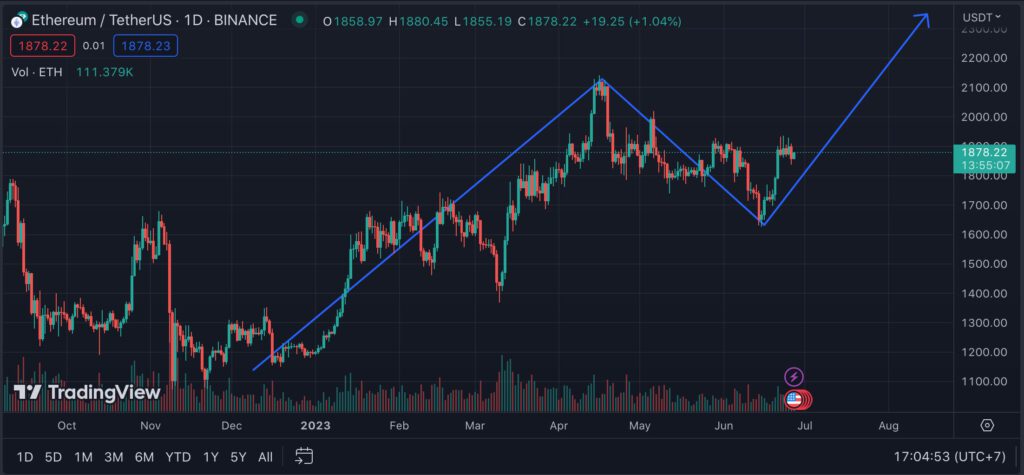
Technical analysis from the daily timeframe provides an optimistic forecast for the Ethereum price. This prospect is mainly based on examining price action and the Elliott wave model.
According to the likely wave model, the Ethereum price has probably completed wave one out of five upward waves (white color), up to the yearly peak on April 17. After that, the Ethereum price entered a gradually declining parallel channel.

Typically, such channels contain correction patterns. In other words, the correction follows the five-wave increase level, with movement such as the WXY pattern (black color).
This view is further supported by the Ethereum current price’s rebound at the 0.5 Fibonacci retracement level, acting as a support level.
The breakthrough from the channel on June 21 confirmed that the correction pattern had been completed. Therefore, the ETH price is predicted to rise to the next long-term resistance level of around $2500. This could be part of wave three in the long-term model.
Despite the optimistic prediction, if the Ethereum price falls back into the parallel channel, it will invalidate the number of upward waves and suggest a downward trend for ETH. In that scenario, a drop to $1200 is very likely to occur.
DISCLAIMER: The information on this website is provided as general market commentary and does not constitute investment advice. We encourage you to do your own research before investing.
Join us to keep track of news: https://linktr.ee/coincu
David
Coincu News


