ETH/BTC Ratio Crashes To A New Low Since April 2021

Key Points:

  • ETH/BTC ratio hits new low, Ethereum struggles against Bitcoin.
  • Market shifts could be swayed by potential verdict on Ethereum ETF.
  • Meme coins dominate Binance’s volume, despite Bitcoin’s rise.
ETH/BTC ratio crashes to a low of 0.046, last seen in April 2021. Ethereum’s position weakens as Bitcoin nears $65,000. Market volatility persists.

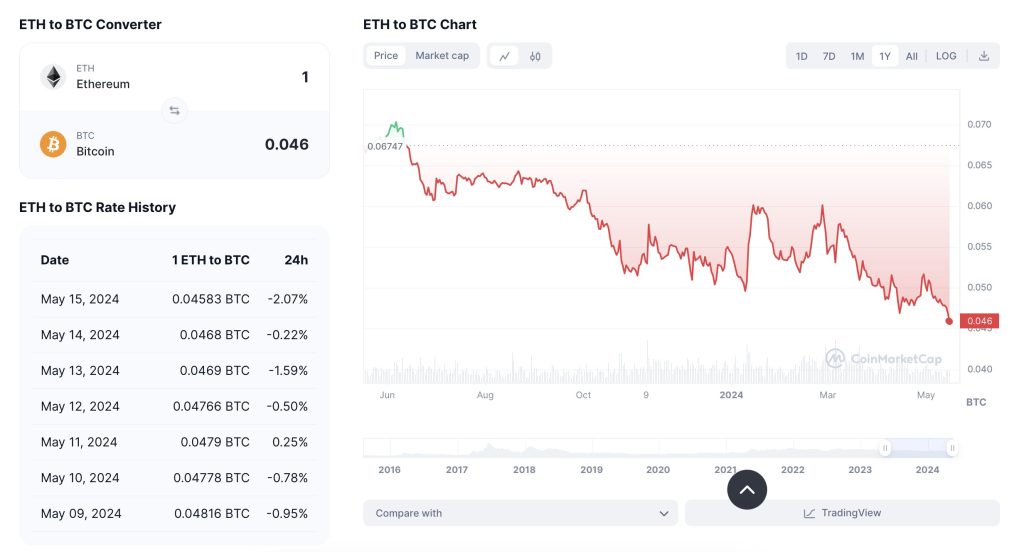
The ETH/BTC ratio has plunged to a new low of 0.046, last observed in April 2021, according to CoinMarketCap’s market data.
ETH/BTC Ratio Crashes To A New Low Since April 2021
Source: CoinMarketCap

ETH/BTC Ratio Crashes to New Low

The conversion rate of ETH to BTC is now at 0.04589 BTC, marking a 0.42% decrease in the last hour and a 2.96% increase in the last 24 hours. However, Ethereum’s overall trend against BTC is downward, with a 5.84% decrease in the last 30 days.

The ETH/BTC ratio’s downward movement underlines Ethereum’s continued struggle against Bitcoin’s dominance in the digital asset market. With a 30% decrease in the past year and over 11% year-to-date, Ethereum’s position is weakening.

Readmore: Bitcoin Jumps After CPI Release By 4% As ETH Hits A Record Low

Market Shifts Influenced by Narratives and Central Bank Liquidity

Market shifts are primarily driven by narratives and central bank liquidity. Ethereum is currently inflationary, a situation that could change with the potential verdict on an Ethereum ETF in the US. This decision could significantly influence Ethereum’s price.

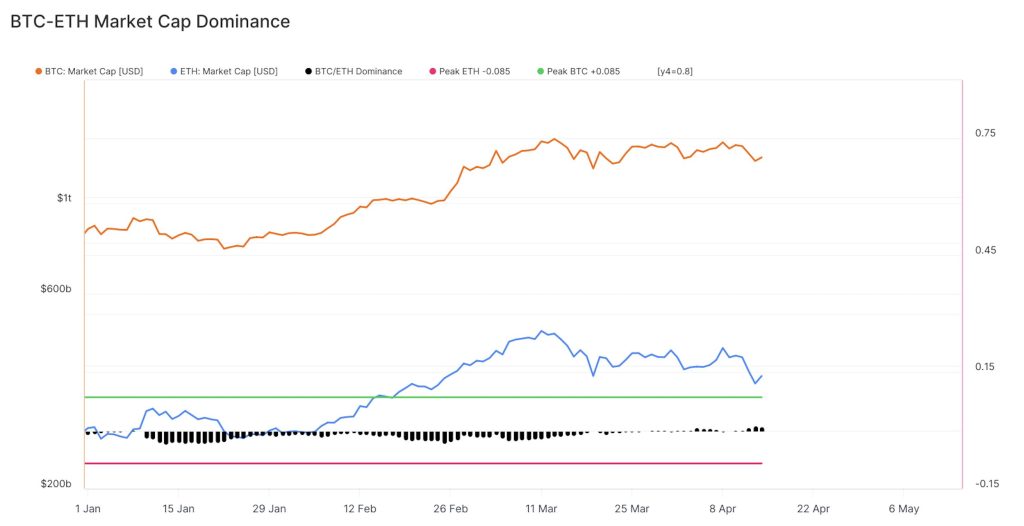
The BTC-ETH Dominance metric from Glassnode, which tracks Bitcoin’s market cap dominance compared to the combined market cap of Bitcoin and Ethereum, is a valuable tool in understanding these macro trends.
ETH/BTC Ratio Crashes To A New Low Since April 2021

Dominance = BTC Market Cap / (BTC Market Cap + ETH Market Cap) – 0.765 with the 0.765 factor included to visualise the oscillator around a long term mean.

  • Higher Values and Uptrends indicate outperformance by Bitcoin.
  • Lower Values and Downtrends indicate outperformance by Ethereum.

Crypto Market Volatility Amidst Bitcoin Surge

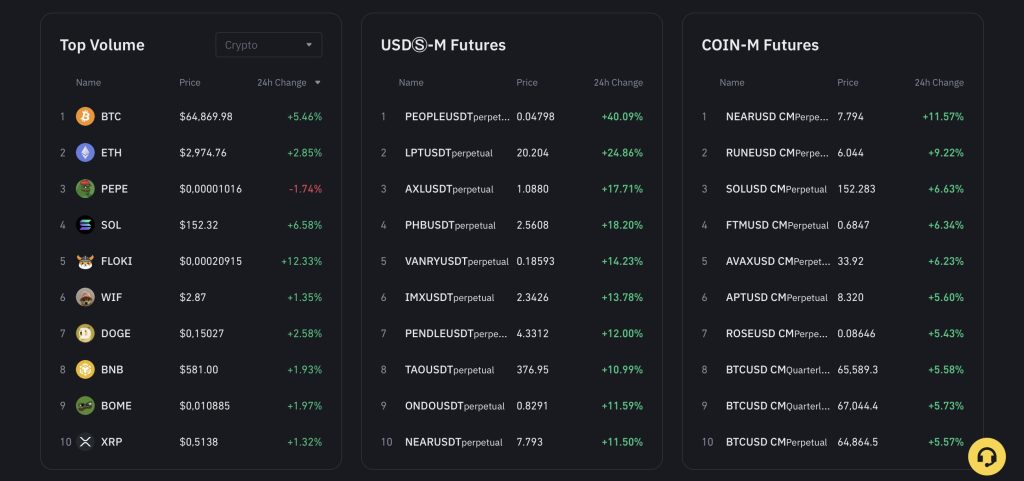
Although Bitcoin’s price nears $65,000, Meme coins still dominate Binance’s trading volume. The majority of the top ten trading volume ranks are occupied by Meme coins.
ETH/BTC Ratio Crashes To A New Low Since April 2021
Source: Binance

The crypto market experienced volatility as Bitcoin surged after a CPI report showed a minor decrease in U.S. inflation. Meanwhile, Ethereum hit an all-time low. Bitcoin’s value climbed by 4% to $65,000, triggering some short-term sellers to hedge.

ETH/BTC Ratio Crashes To A New Low Since April 2021

Key Points:

  • ETH/BTC ratio hits new low, Ethereum struggles against Bitcoin.
  • Market shifts could be swayed by potential verdict on Ethereum ETF.
  • Meme coins dominate Binance’s volume, despite Bitcoin’s rise.
ETH/BTC ratio crashes to a low of 0.046, last seen in April 2021. Ethereum’s position weakens as Bitcoin nears $65,000. Market volatility persists.

The ETH/BTC ratio has plunged to a new low of 0.046, last observed in April 2021, according to CoinMarketCap’s market data.

ETH/BTC Ratio Crashes To A New Low Since April 2021
Source: CoinMarketCap

ETH/BTC Ratio Crashes to New Low

The conversion rate of ETH to BTC is now at 0.04589 BTC, marking a 0.42% decrease in the last hour and a 2.96% increase in the last 24 hours. However, Ethereum’s overall trend against BTC is downward, with a 5.84% decrease in the last 30 days.

The ETH/BTC ratio’s downward movement underlines Ethereum’s continued struggle against Bitcoin’s dominance in the digital asset market. With a 30% decrease in the past year and over 11% year-to-date, Ethereum’s position is weakening.

Readmore: Bitcoin Jumps After CPI Release By 4% As ETH Hits A Record Low

Market Shifts Influenced by Narratives and Central Bank Liquidity

Market shifts are primarily driven by narratives and central bank liquidity. Ethereum is currently inflationary, a situation that could change with the potential verdict on an Ethereum ETF in the US. This decision could significantly influence Ethereum’s price.

The BTC-ETH Dominance metric from Glassnode, which tracks Bitcoin’s market cap dominance compared to the combined market cap of Bitcoin and Ethereum, is a valuable tool in understanding these macro trends.

ETH/BTC Ratio Crashes To A New Low Since April 2021

Dominance = BTC Market Cap / (BTC Market Cap + ETH Market Cap) – 0.765 with the 0.765 factor included to visualise the oscillator around a long term mean.

  • Higher Values and Uptrends indicate outperformance by Bitcoin.
  • Lower Values and Downtrends indicate outperformance by Ethereum.

Crypto Market Volatility Amidst Bitcoin Surge

Although Bitcoin’s price nears $65,000, Meme coins still dominate Binance’s trading volume. The majority of the top ten trading volume ranks are occupied by Meme coins.

ETH/BTC Ratio Crashes To A New Low Since April 2021
Source: Binance

The crypto market experienced volatility as Bitcoin surged after a CPI report showed a minor decrease in U.S. inflation. Meanwhile, Ethereum hit an all-time low. Bitcoin’s value climbed by 4% to $65,000, triggering some short-term sellers to hedge.