Bitcoin Analysis Signals 2017 Deja Vu With Volatility Rising
Key Points:
- Bitcoin faces possible volatility, with price patterns mimicking 2017.
- Retail investors may be buying at ATH while whales look to profit.
- A pullback to $70,000 is likely, with increasing institutional involvement.
Bitcoin analysis shows similarities to 2017’s market conditions. Current speculation suggests a potential pullback to $70,000. Experts advise caution amid high volatility.

Bitcoin Analysis: A Deja Vu from 2017?
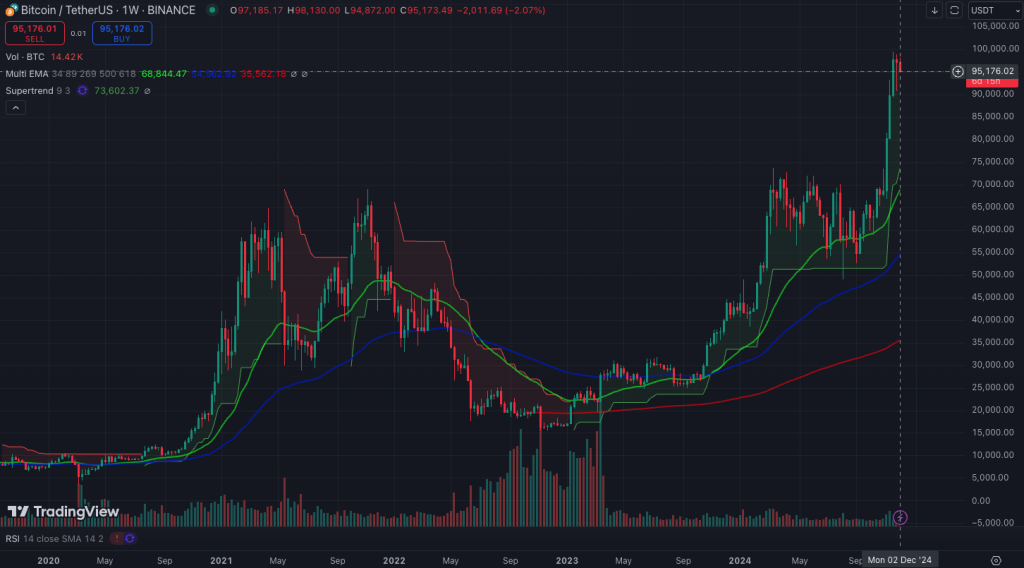
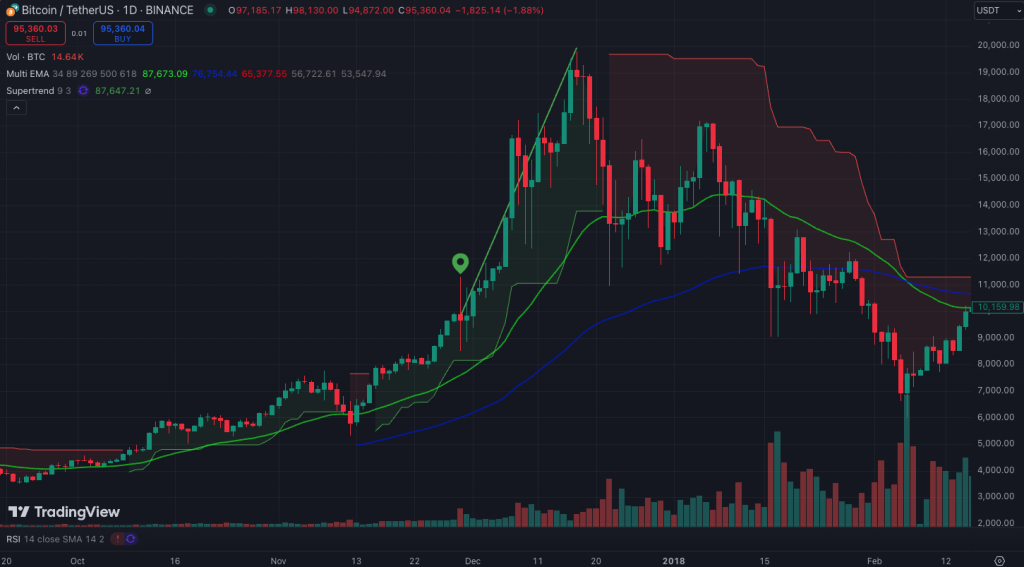
Looking at the Bitcoin (BTC) weekly chart and reflecting on historical trends, the potential for volatility is evident. Let’s take a step back and compare the current market sentiment to December 1, 2017—a key time in Bitcoin’s history.

The 2017 Bull Run
On December 1, 2017, Bitcoin went down to $9,410 before embarking on its historic ride to $19,700, marking an incredible 109% price surge.

Such a monumental increase coincided with the launch of Bitcoin futures trading products by both the Chicago Mercantile Exchange (CME) and the Chicago Board Options Exchange (CBOE). These launches attracted institutional investors, bringing in massive liquidity and signalling Bitcoin’s growing legitimacy.
Fast Forward to Today
Fast forward to today, BTC seems to be at a critical juncture once again. Retail investors, hopeful that the bull run will continue, are entering the market in droves. However, many may be forgetting the lessons from 2017.
- Whales who hold large amounts of Bitcoin often manipulate price movements to their advantage by buying during the dips and selling into rallies.
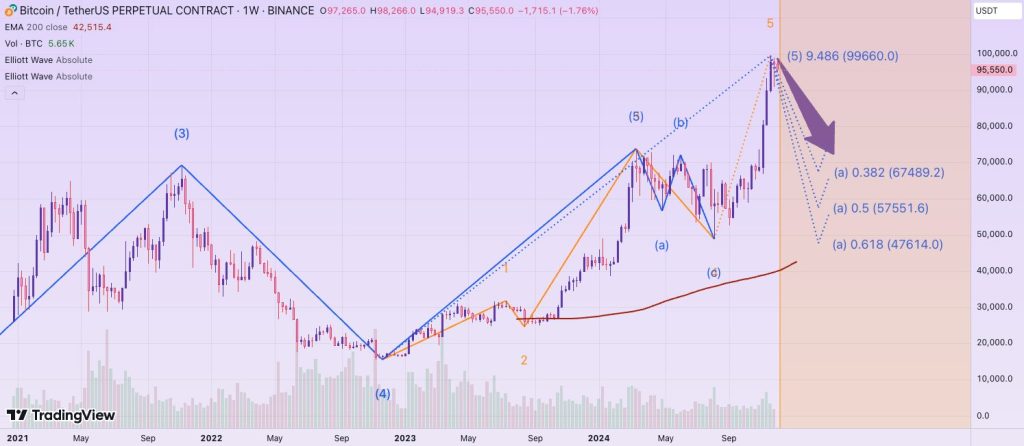
- Currently, speculation suggests that Bitcoin could face a significant short-term downside, with some experts warning it might fall as low as $70,000.

- The upcoming BTC options launch on the CBOE adds another layer of volatility, as this could lead to a major market correction as traders adjust their positions in response to the new financial instruments.
Historical Patterns and a Potential Pullback
Historically, BTC has shown similar price patterns before major corrections. As the price hovers near ATH (All-Time Highs), we might be seeing a “final warning” for those entering the market without caution. However, the chart suggests that a strong pullback may be coming soon.
- Retail investors may be buying at the peak, just like they did in 2017.
- Meanwhile, institutional players are likely capitalizing on this behaviour, manipulating market movements to their advantage.
What Traders Should Do
For traders, the current market could present an opportunity to wait for a pullback to $70,000 before considering new positions. However, if Bitcoin does continue its ascent despite the warning signs, a conservative approach with tight stop-loss limits (for example, around $105,000) would minimize the risk of substantial losses.
The volatility is expected to increase as Bitcoin enters this next phase of institutional integration and increased speculation. It’s essential to stay cautious and be prepared for unexpected price fluctuations.
| DISCLAIMER: The information on this website is provided as general market commentary and does not constitute investment advice. We encourage you to do your own research before investing. |


