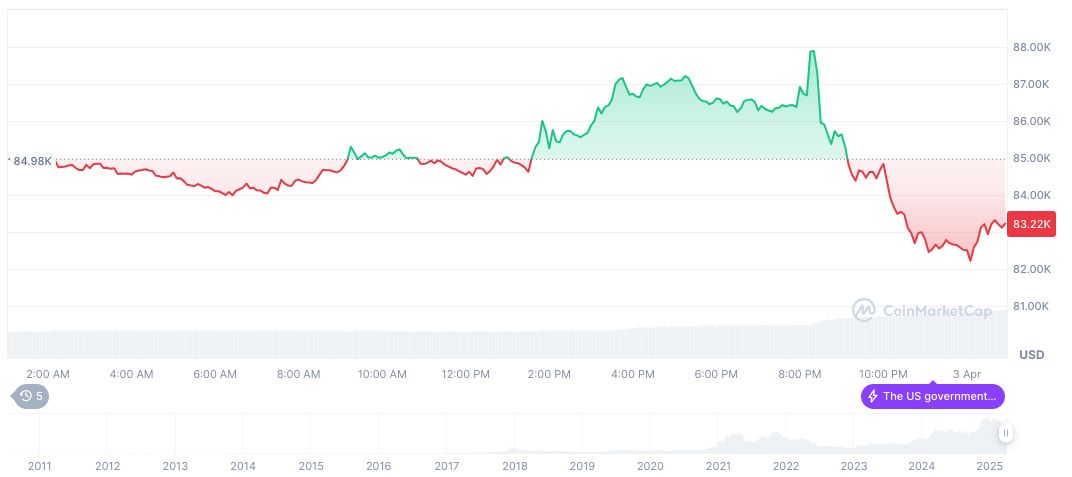
- Glassnode reports Bitcoin’s VWAPs crossing, indicating potential bearish momentum.
- Bitcoin price drops 4.5% following VWAP crossover announcement.
- Market signals suggest possible extended bearish trend in coming months.
Glassnode’s recent analysis revealed on April 3, 2025, a crossover of Bitcoin’s 30-day VWAP below its 180-day VWAP, reminiscent of a historic bearish signal.
This technical indicator is significant due to its history of aligning with bearish trends, affecting Bitcoin’s market stance and indicating potential volatility.
Glassnode Identifies Key VWAP Crossover on April 3, 2025
Glassnode, recognized for blockchain analytics, identified the crossover of Bitcoin’s 30-day VWAP beneath its 180-day VWAP, signaling possible bearish momentum. Bitcoin has responded with a price drop of 4.5%, reaching $62,345. This pattern suggests potential market caution. “We have highlighted a potential bearish signal where Bitcoin’s 30-day Volume Weighted Average Price moved below its 180-day VWAP, resembling a ‘death cross’ indicative of weakening market momentum.” – Glassnode Insights
Bitcoin, along with Ethereum and Litecoin, showed price declines—3.2% and 5.1%, respectively—reflecting broad market implications. Historically, such crossovers have often led to lengthy bearish trends, hinting at possible extended downturns for cryptocurrencies.
Market chatter from traders on platforms like Telegram highlights support levels at $58,000 and $55,000. Regulatory responses remain unchanged, but institutional trading shows slowdown signs, hinting at investor wariness.
Historic Patterns Suggest Extended Bearish Trend Possible
Did you know? The VWAP crossover bears similarity to past signals that preceded downturns, like in 2021 when Bitcoin saw a six-month decline post-signal.
CoinMarketCap reports Bitcoin’s current price at $81,935.93 with a market cap of 1,626,095,956,769.00. Bitcoin’s market dominance remains at 62.23%, while its 24-hour trading volume fluctuated heavily, experiencing a dramatic change of 98.81%.

Expert analysis from Coincu suggests financial outcomes could involve continued bearish pressure unless disruption occurs via new investor interest. Regulatory developments may further influence market dynamics, amid evolving crypto policies.


