Analyst Eric Wall: You Missed The Best Bitcoin ‘Fire Sale’

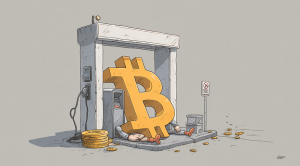
Analyst Eric Wall says investors just missed the Bitcoin fire sale. The provocative expert commented after the Bitcoin price peaked at over $24,000 this Wednesday.
image 1331
Analyst Eric Wall

Throughout July, BTC hovered around or below the $20,000 mark. BTC price has slipped slightly to $23,200 but is still up 11.7% over the past 30 days.

Screen Shot 2022 07 22 at 2.30.17 PM
BTC daily chart. Source: CoinCu

Eric Wall is basing his most recent assertion on the “Bitcoin Rainbow Price Chart,” an analysis tool created by Blockchain Center, which in Wall’s capable hands doubles as both meme bait and trolling device.

image 1329
Bitcoin Rainbow Price Chart. Source: Blockchain Center

The logarithmic price chart measures Bitcoin price action against a rainbow, with each color corresponding to action investors should take. The hot colors of the rainbow represent an overheated market and have labels such as “Maximum Bubble Territory” and “Sell. Seriously, SELL!”. In contrast, cool colors are marked with “Accumulate” and “Buy.”

The chart turned from blue to green when the BTC price surged on Wednesday. Immediately, Wall declared the moment inevitable.

While Wall is very supportive of rainbow charts, his posts are more skeptical. As Blockchain Center says, rainbow charts are a fun way to check BTC price action and are not severe investment advice.

Many crypto Twitter users quickly pointed out that BTC’s rallies occur amid a bear market and that crypto winter is likely to return. Meanwhile, other participants didn’t appreciate Wall’s comment, seeming to think it silly to follow a rainbow-based price chart blindly.

image 1330
Analyst Eric Wall: You Missed The Best Bitcoin 'Fire Sale' 5

The severity of the recent bear market is a practical test for predictive models that have made headlines for a while. In June, Vitalik Buterin criticized the stock-to-flow analysis model for providing false certainty in a volatile market.

“I think financial models that give people a false sense of certainty and predestination that the number-will-go-up are harmful and deserve all the mockery they get,” said Buterin.

The rainbow price chart has probably remained unbroken for now, but no chart or predictive model can replace critical thinking.

DISCLAIMER: The Information on this website is provided as general market commentary and does not constitute investment advice. We encourage you to do your own research before investing.

Join CoinCu Telegram to keep track of news: https://t.me/coincunews

Follow CoinCu Youtube Channel | Follow CoinCu Facebook page

Harold

CoinCu News

Analyst Eric Wall: You Missed The Best Bitcoin ‘Fire Sale’

Analyst Eric Wall says investors just missed the Bitcoin fire sale. The provocative expert commented after the Bitcoin price peaked at over $24,000 this Wednesday.
image 1331
Analyst Eric Wall

Throughout July, BTC hovered around or below the $20,000 mark. BTC price has slipped slightly to $23,200 but is still up 11.7% over the past 30 days.

Screen Shot 2022 07 22 at 2.30.17 PM
BTC daily chart. Source: CoinCu

Eric Wall is basing his most recent assertion on the “Bitcoin Rainbow Price Chart,” an analysis tool created by Blockchain Center, which in Wall’s capable hands doubles as both meme bait and trolling device.

image 1329
Bitcoin Rainbow Price Chart. Source: Blockchain Center

The logarithmic price chart measures Bitcoin price action against a rainbow, with each color corresponding to action investors should take. The hot colors of the rainbow represent an overheated market and have labels such as “Maximum Bubble Territory” and “Sell. Seriously, SELL!”. In contrast, cool colors are marked with “Accumulate” and “Buy.”

The chart turned from blue to green when the BTC price surged on Wednesday. Immediately, Wall declared the moment inevitable.

While Wall is very supportive of rainbow charts, his posts are more skeptical. As Blockchain Center says, rainbow charts are a fun way to check BTC price action and are not severe investment advice.

Many crypto Twitter users quickly pointed out that BTC’s rallies occur amid a bear market and that crypto winter is likely to return. Meanwhile, other participants didn’t appreciate Wall’s comment, seeming to think it silly to follow a rainbow-based price chart blindly.

image 1330
Analyst Eric Wall: You Missed The Best Bitcoin 'Fire Sale' 10

The severity of the recent bear market is a practical test for predictive models that have made headlines for a while. In June, Vitalik Buterin criticized the stock-to-flow analysis model for providing false certainty in a volatile market.

“I think financial models that give people a false sense of certainty and predestination that the number-will-go-up are harmful and deserve all the mockery they get,” said Buterin.

The rainbow price chart has probably remained unbroken for now, but no chart or predictive model can replace critical thinking.

DISCLAIMER: The Information on this website is provided as general market commentary and does not constitute investment advice. We encourage you to do your own research before investing.

Join CoinCu Telegram to keep track of news: https://t.me/coincunews

Follow CoinCu Youtube Channel | Follow CoinCu Facebook page

Harold

CoinCu News