US PPI July: Monthly 0.1% vs 0.2% Expected, Annual Lowered!

Key points:

  • The Producer Price Index (PPI) for July rose by just 0.1%, missing the expected 0.2% and the previous month’s 0.2%. This suggests a slower inflation rate.
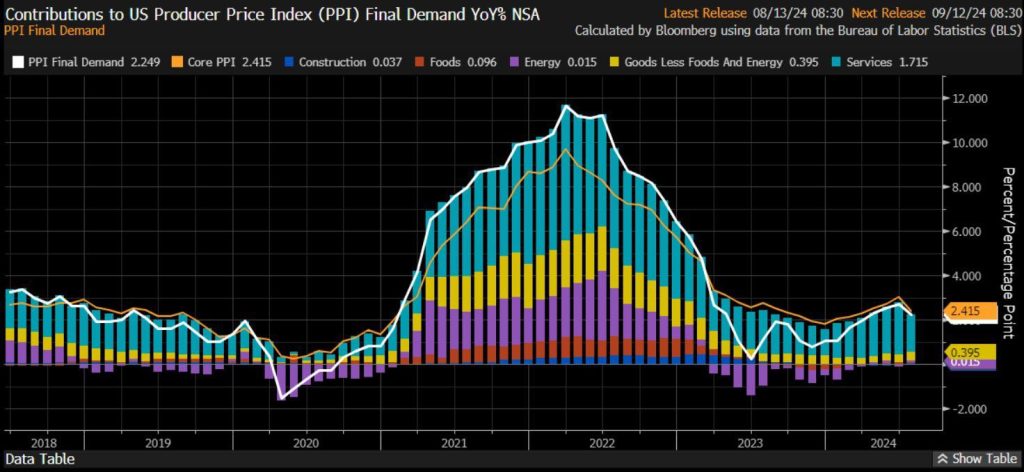
  • The US PPI July rate was 2.2%, under the forecast of 2.3%. The previous year’s rate was revised to 2.7%, indicating a moderate inflation slowdown.
  • With the US PPI July data, investors are closely watching this week’s Consumer Price Index (CPI) for clues on whether the Fed will cut rates by 50 or 25 basis points in September. The decision remains uncertain.
The US PPI July was posted at a month-on-month rate of 0.1%, missing the expected 0.2% and the previous month’s 0.2%.
US PPI July: Monthly 0.1% vs 0.2% Expected, Annual Lowered!

The July annual PPI rate was 2.2%, missing the forecast of 2.3%. The past year’s rate has been revised from 2.6% to 2.7%.

US PPI July Rate Falls Short of Expectations

The broad PPI came in lower than expected, with the rise in commodity prices balanced by falling service prices, suggesting continued deceleration of inflation. Lower-than-anticipated PPI figures paint a mixed picture of inflation.

While commodity prices rose, service-price retreats tempered overall inflationary pressures. This divergence in trends suggests that while inflation is easing, it is not doing so uniformly across sectors.

Read more: US Core CPI Data Shows Inflation Cooling, Bitcoin Backs Above $59,000

Investors Await CPI Data for Fed Rate Cut Decision
US PPI July: Monthly 0.1% vs 0.2% Expected, Annual Lowered!

According to QCP, market analysts indicated that investors are cautious ahead of this week’s U.S. Consumer Price Index data. The next CPI will likely shed light on the Federal Reserve’s future course of action.

With highly scrutinised inflation metrics, investors are watching whether the Fed will cut 50 or 25 basis points in September. In an average case, these odds are evenly divided between the two mentioned scenarios, showing the amount of uncertainty in markets.

DISCLAIMER: The information on this website is provided as general market commentary and does not constitute investment advice. We encourage you to do your own research before investing.

US PPI July: Monthly 0.1% vs 0.2% Expected, Annual Lowered!

Key points:

  • The Producer Price Index (PPI) for July rose by just 0.1%, missing the expected 0.2% and the previous month’s 0.2%. This suggests a slower inflation rate.
  • The US PPI July rate was 2.2%, under the forecast of 2.3%. The previous year’s rate was revised to 2.7%, indicating a moderate inflation slowdown.
  • With the US PPI July data, investors are closely watching this week’s Consumer Price Index (CPI) for clues on whether the Fed will cut rates by 50 or 25 basis points in September. The decision remains uncertain.
The US PPI July was posted at a month-on-month rate of 0.1%, missing the expected 0.2% and the previous month’s 0.2%.
US PPI July: Monthly 0.1% vs 0.2% Expected, Annual Lowered!

The July annual PPI rate was 2.2%, missing the forecast of 2.3%. The past year’s rate has been revised from 2.6% to 2.7%.

US PPI July Rate Falls Short of Expectations

The broad PPI came in lower than expected, with the rise in commodity prices balanced by falling service prices, suggesting continued deceleration of inflation. Lower-than-anticipated PPI figures paint a mixed picture of inflation.

While commodity prices rose, service-price retreats tempered overall inflationary pressures. This divergence in trends suggests that while inflation is easing, it is not doing so uniformly across sectors.

Read more: US Core CPI Data Shows Inflation Cooling, Bitcoin Backs Above $59,000

Investors Await CPI Data for Fed Rate Cut Decision

US PPI July: Monthly 0.1% vs 0.2% Expected, Annual Lowered!

According to QCP, market analysts indicated that investors are cautious ahead of this week’s U.S. Consumer Price Index data. The next CPI will likely shed light on the Federal Reserve’s future course of action.

With highly scrutinised inflation metrics, investors are watching whether the Fed will cut 50 or 25 basis points in September. In an average case, these odds are evenly divided between the two mentioned scenarios, showing the amount of uncertainty in markets.

DISCLAIMER: The information on this website is provided as general market commentary and does not constitute investment advice. We encourage you to do your own research before investing.

Visited 17 times, 17 visit(s) today