$112684.67
• Shanghai SASAC Explores Blockchain Integration Strategies
• Coinbase Partners With Perplexity AI to Deliver Real-Time Crypto Data to Traders
• U.S. Treasury Revokes Crypto Exchange Reporting Regulations
• Bybit EU: Building Trust in a Regulated European Crypto Future
• Fed Official Advocates for Stablecoin Regulatory Framework
• Fed’s Mester Warns of Unsustainable U.S. Fiscal Deficit
• $MBG Token Pre-Sale Set for July 15 — Only 7 million Tokens Available at $0.35
• Federal Reserve’s Mester Discusses Economic Outlook Amid Inflation Concerns
• Binance to Launch High-Leverage CROSSUSDT and AINUSDT Contracts
• Snoop Dogg Makes $12M in 30 Min on Telegram NFTs
Spot Bitcoin ETF Flows Tracker: Daily Data And Charts!
Bitcoin ETF Flow Table
The Bitcoin ETF Flow Table is a concise, organized representation of the investment movements and trends within Bitcoin Exchange Traded Funds (ETFs). It tracks the inflow and outflow of funds, providing investors with insights into market sentiment, investment volume, and overall activity in Bitcoin ETFs. This data is crucial for making informed decisions in the cryptocurrency investment landscape.
Bitcoin ETF Tracker

What is a Bitcoin ETF?
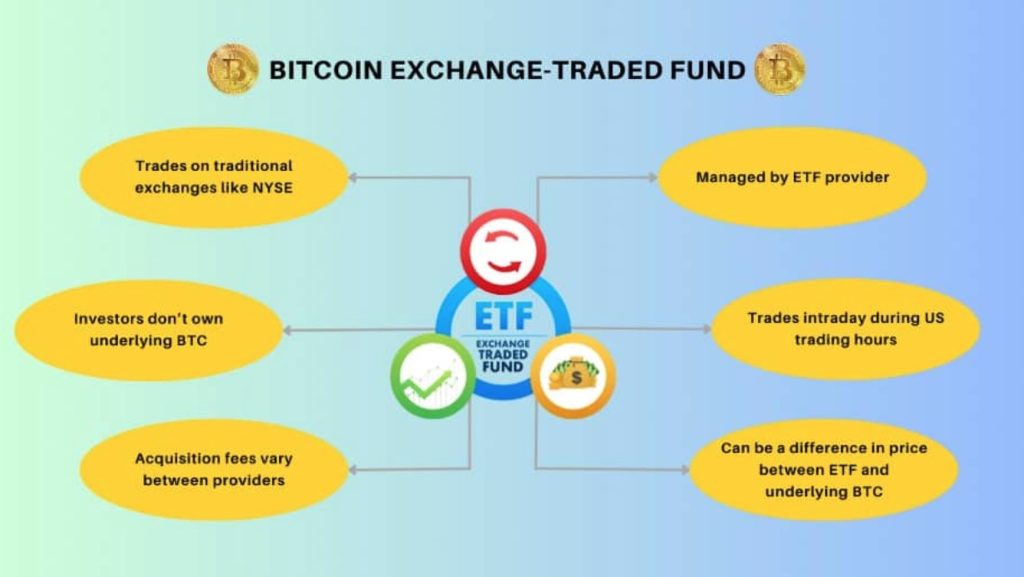
The Bitcoin ETF is a game-changer for investors seeking exposure to the value of Bitcoin within the traditional financial market landscape. Unlike conventional cryptocurrency exchanges, these ETFs trade on established market exchanges, offering a convenient avenue for investors to engage with Bitcoin without the complexities associated with digital asset platforms. In essence, a Bitcoin ETF functions as a financial instrument that mirrors the value of Bitcoin, providing investors with a regulated and accessible means to participate in the cryptocurrency market. This innovation eliminates the need for investors to navigate the often intricate processes of cryptocurrency exchanges, streamlining the investment experience and making it more user-friendly.
How Does Bitcoin ETF Work?
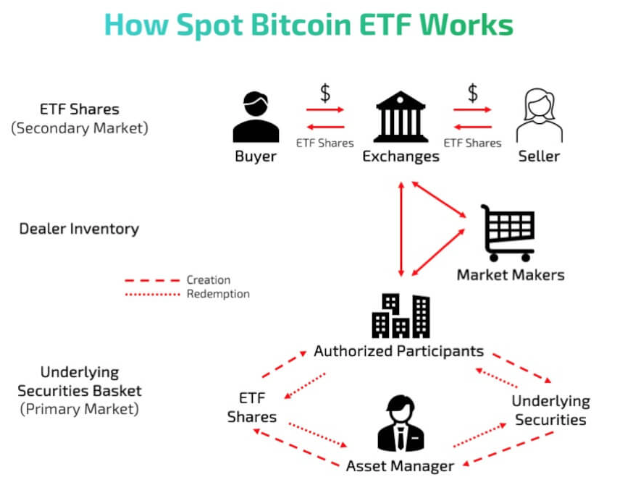
Functioning similarly to traditional ETFs, a Bitcoin ETF would mirror the fluctuations in the price of Bitcoin. In essence, the value of one share of the exchange-traded fund would correlate directly with the market value of Bitcoin. If the price of Bitcoin rises, the ETF’s value follows suit, and conversely, a decrease in Bitcoin’s value would be reflected in the ETF. What sets a Bitcoin ETF apart is its trading platform. Unlike traditional cryptocurrencies that trade on specialized cryptocurrency exchanges, a Bitcoin ETF would find its home on well-established market exchanges such as the New York Stock Exchange (NYSE) or the Toronto Stock Exchange (TSX). Read MoreWhat Are the Differences Between Bitcoin ETFs?
Spot Bitcoin ETFs

Bitcoin Futures ETF
Another intriguing investment avenue is the realm of futures contracts, standardized agreements where two parties commit to exchanging a specific quantity of a standardized asset on a predetermined future date at an agreed-upon price. Bitcoin futures contracts, for instance, find their home on the Chicago Mercantile Exchange (CME), providing a regulated platform for cryptocurrency trading. Combining these two financial innovations—ETFs and futures contracts—leads us to the concept of a Bitcoin futures ETF—an exchange-traded fund that acquires and holds Bitcoin futures contracts while issuing shares of the fund to investors. What distinguishes this investment vehicle is the ability for investors to buy and sell these shares on mainstream exchanges, introducing a level of accessibility not typically associated with direct cryptocurrency trading. Read MoreWhat is a Daily Flow Chart in the context of a Bitcoin ETF?
A Daily Flow Chart is a comprehensive tool that visualizes the daily trading volume, inflows, and outflows of a Bitcoin ETF. It serves as an indispensable resource for investors and market analysts alike, providing them with in-depth insights into investor sentiment as well as emerging market trends. By analyzing the data presented in the chart, one can gain a clearer understanding of the degree of market activity surrounding the Bitcoin ETF on any given day. This can potentially reveal valuable information about the overall health of the market, the behavior of investors, and the direction in which the market is likely to move in the near future.Why is the Spot Bitcoin ETF Flows Chart important for investors?
The provided chart is a valuable tool for investors, allowing a comprehensive understanding of the ETF’s liquidity, crucial for assessing market trade ease. It offers insights into daily trading activity and investor confidence, hinting at Bitcoin interest levels. This information is useful for potential cryptocurrency investors, aiding strategic decision-making.How can I access the Daily Spot Bitcoin ETF Flows Chart?
These charts are typically available on financial news websites, investment platforms, and sometimes directly from the ETF provider’s website.What key indicators should I look for in the Daily Spot Bitcoin ETF Flows Chart?
These charts, which provide a visual representation of an ETF’s performance over a given time period, are typically available on a number of different platforms. This includes financial news websites, which often have dedicated sections for market data and investment analysis, and investment platforms, where users can directly buy and sell ETFs. Additionally, these charts can sometimes be found directly on the ETF provider’s website. The provider may offer this information as a part of their service to help potential investors make informed decisions about investing in their fund.Can fluctuations in the Daily Bitcoin ETF Flows Chart predict Bitcoin’s price movements?
While the chart certainly offers a wealth of valuable insights into potential market trends, it is important to remember that attempting to predict exact price movements based solely on daily flows can be somewhat speculative in nature. It is essential that such predictions are not considered in isolation, but rather as one piece of a larger, more comprehensive analysis. This broader analysis should ideally incorporate a wide range of other relevant market indicators and financial factors in order to provide a more accurate and reliable forecast.How often is the Spot Bitcoin ETF Flows Daily Chart updated?
It’s usually updated daily to reflect the previous trading day’s activity.Does a high volume of inflows always indicate a bullish trend for Bitcoin?
It’s not necessarily a given. While high inflows of capital can indeed suggest an increased interest in a particular market or asset, they should not be viewed in isolation. It’s much more prudent to analyze these inflows in conjunction with other market factors. These might include things like political events, economic data releases, or shifts in monetary policy.How do outflows affect the price of a Bitcoin ETF?
When there are significant outflows from an ETF, this could potentially exert a downward pressure on the ETF’s price. These outflows generally indicate a selling pressure, which is a result of investors selling off their holdings. Alternatively, it could also be a sign of reduced investor interest in the ETF. Both scenarios can lead to a decrease in demand for the ETF, and in turn, a drop in its price. Understanding these dynamics can provide valuable insights into the market’s perception of the ETF.Are there fees associated with investing in a Bitcoin ETF?


