$109249.326
At CoinCu News, we give both basic and in-depth articles on the latest news in the cryptocurrency and blockchain sectors.
Mayowa is a seasoned freelance writer specializing in creating compelling, high-converting content across diverse industries.
With extensive experience working with major news outlets, personal blogs, and private clients, he brings a deep understanding of audience engagement and storytelling. His expertise spans SEO optimization, persuasive copywriting, and niche versatility, ensuring content that resonates and delivers results.
Armed with a strong command of the English language and a keen eye for detail, he crafts content that is both impactful and strategically tailored to meet client goals.
News
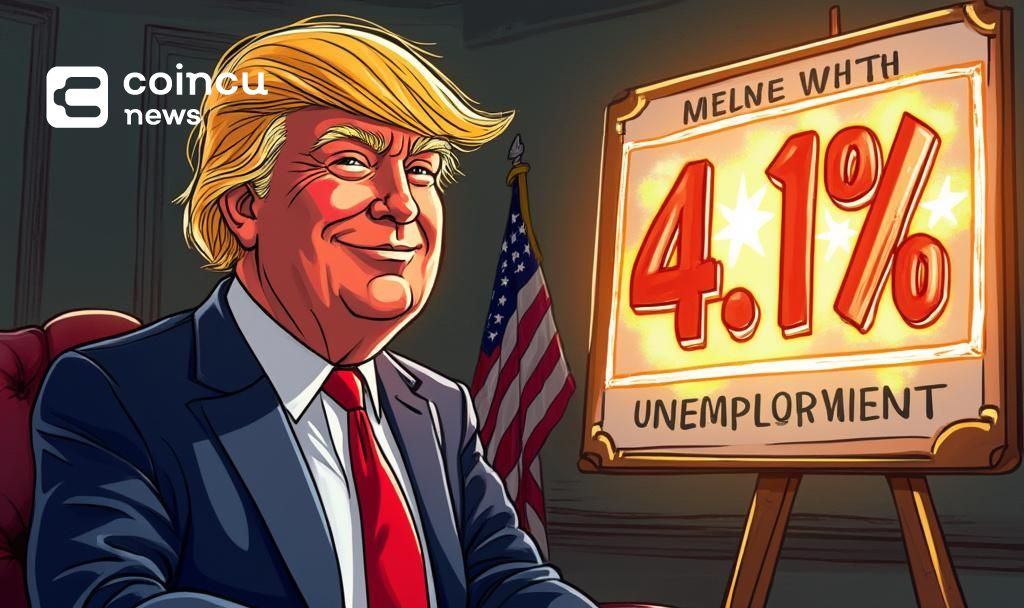
U.S. Economic Data Surpasses Expectations with Lower Unemployment Rate
U.S. President Trump hails unexpected unemployment drop to 4.1%, boosting economic sentiment.
Jul
Stablecoin Legislation May Boost Crypto Industry to Trillions
Bo Hines discusses stablecoin legislation’s potential to grow the crypto industry to a $15-$20 trillion
Jul
No Official Confirmation on Binance’s 28th TGE Featuring Palio
Unverified claims circulate about Binance's 28th TGE for Palio. Official confirmation remains pending.
Jul
IMF Rejects Pakistan’s Crypto Mining Electricity Plan
IMF rejects Pakistan's subsidized electricity plan for crypto mining, citing potential grid strain.
Jul
Pomerantz LLP Files Lawsuit Against Strategy Company Over Bitcoin Losses
Pomerantz LLP sues Strategy for misleading Bitcoin investment claims. Investors involved may join by July
Jul
Coinbase Adds Sky and USDS to Listing Roadmap
Sky and USDS join Coinbase's listing roadmap, signaling potential market shifts. Full details inside.
Jul
U.S. House Schedules Vote on Crypto Bill Today
The U.S. House is voting on the 'Big and Beautiful' crypto bill today, impacting market
Jul
Connecticut Prohibits State Entities from Holding Cryptocurrency
Connecticut enacts Bitcoin Reserve Ban affecting state entity cryptocurrency holdings.
Jul
Upbit Lists MOODENG on Solana Network
Upbit lists MOODENG on Solana, offering KRW, BTC, USDT trading pairings; market sees potential shifts.
Jul
[tptn_list how_old="7" limit="5" title_length="0" heading="0" show_date="0" ]
[tptn_list how_old="30" limit="5" title_length="0" heading="0" show_date="0" ]


