
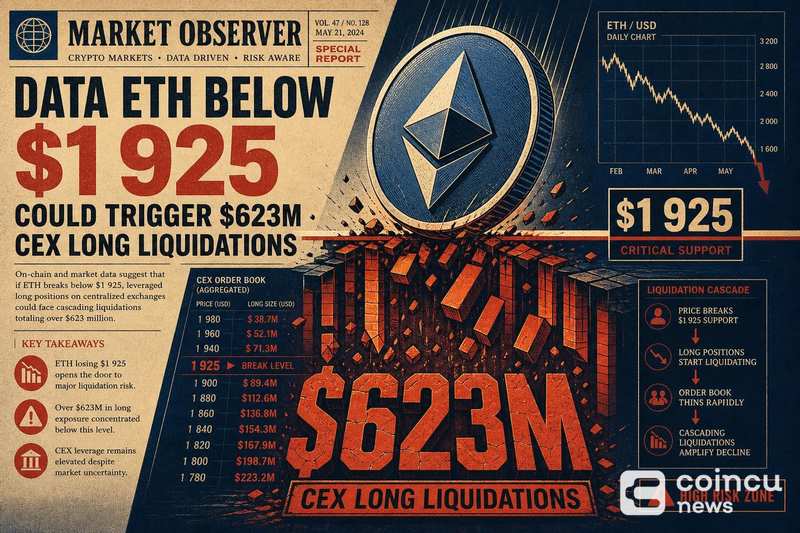

Liquidation data indicates that if ETH falls below $1,925, the cumulative long liquidation intensity across mainstream centralized exchanges could reach $623 million, marking a significant conditional risk threshold for leveraged traders.
The $623 million figure represents cumulative long liquidation intensity, not a guaranteed outcome. It measures the total value of long positions that would face forced closure if ETH breaches and sustains below the $1,925 level across major centralized exchanges. Ethereum currently trades on spot markets tracked by platforms such as CoinGecko, where traders can monitor real-time price proximity to this threshold.
This is a conditional metric. The liquidations only materialize if spot price moves below the threshold and remains there long enough for exchange engines to execute margin calls.

Why $1,925 Functions as a Liquidation Cluster
Long positions on centralized exchanges use deposited collateral to maintain leverage. When ETH price declines toward a trader’s liquidation price, the collateral ratio deteriorates until the exchange force-closes the position to recover lent funds.
When many traders set similar entry points or use similar leverage ratios, their liquidation prices cluster around the same level. The $1,925 mark appears to be one such cluster where a high density of long positions would simultaneously become undercollateralized.
Forced liquidations execute as market sell orders. A large volume of simultaneous sell pressure can push price further down, triggering additional liquidations at lower levels. This feedback loop is what makes clustered liquidation zones particularly dangerous for leveraged participants.
Previous instances of ETH approaching similar liquidation-dense zones, such as when ETH traded near $1,921 with $781 million in potential long liquidation risk, demonstrate how these thresholds shift as traders adjust positions.

Three Scenarios Around the $1,925 Level
Scenario 1: Price holds above $1,925. If ETH maintains support above this level, the $623 million in latent liquidation intensity remains unrealized. Traders keep their positions open, and the liquidation cluster may gradually dissipate as positions are closed voluntarily or adjusted.
Scenario 2: Brief wick below $1,925. A fast dip below the threshold could trigger partial liquidations, particularly for positions with tight margin buffers. If price recovers quickly, the full cumulative amount would not execute. Slippage risk increases during such wicks due to thin order book depth near liquidation zones.
Scenario 3: Sustained break below $1,925. A decisive move below the level with follow-through selling would convert latent liquidation intensity into executed liquidations. The resulting forced sell pressure could accelerate downside momentum, potentially cascading into lower liquidation clusters. Ethereum’s market capitalization and trading volume provide context for how significant a $623 million liquidation event would be relative to overall market depth.
Market participants watching broader altcoin movements, including tokens like BNB which recently saw significant price swings, understand how quickly sentiment shifts can propagate across assets during high-volatility periods.
Risk Management Near High-Liquidation Zones
Traders holding leveraged long positions near the $1,925 level face asymmetric risk. The concentration of potential liquidations means that any breach of this level could produce outsized volatility compared to normal price action.
Position sizing becomes critical around event levels. Reducing leverage exposure before price reaches a known liquidation cluster limits the probability of forced closure. Setting invalidation points above the cluster, rather than at or below it, provides a margin of safety.
Cascade events typically unfold within minutes. Emotional re-entries during active liquidation cascades carry elevated risk because order book liquidity thins rapidly as market makers pull bids. Waiting for stabilization after a cascade completes generally offers better risk-adjusted entry conditions.
These principles apply whether ETH ultimately holds key support levels or breaks through them, as similar dynamics have played out across multiple assets recently.
FAQ: ETH Liquidation Data and Market Impact
What does liquidation intensity mean? Liquidation intensity measures the cumulative dollar value of leveraged positions that would be force-closed at a given price level. It reflects potential, not realized, liquidation volume.
Does $623 million mean guaranteed liquidation? No. The figure is conditional on ETH falling below $1,925 and staying there. Traders can reduce exposure, add collateral, or close positions before the level is reached, which would reduce the actual liquidation amount.
Why is $1,925 specifically a key level? It represents a price point where an unusually high concentration of long positions across mainstream centralized exchanges would simultaneously breach their margin requirements based on current open interest and leverage distribution.
Are DEX positions included in this figure? The figure covers mainstream centralized exchanges only. Decentralized exchange liquidations operate through different mechanisms, including on-chain liquidation bots and protocol-specific health factors, and are tracked separately.
Disclaimer: This article is for informational purposes only and does not constitute financial or investment advice. Cryptocurrency and digital asset markets carry significant risk. Always do your own research before making decisions.

