
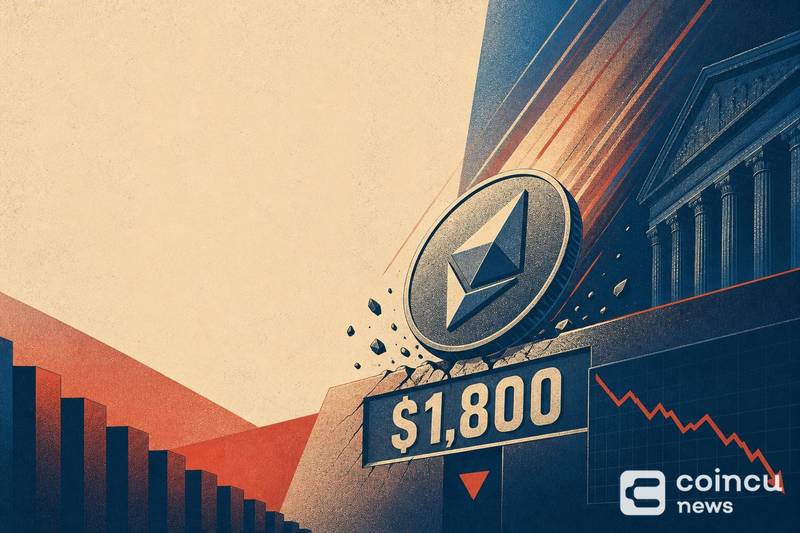

Ether slipped below the $1,800 level after declining roughly 1% over 24 hours, reinforcing a pattern of repeated rejections at that psychological threshold. The move places ETH near a contested zone where bulls and bears have clashed throughout recent weeks.
Ether Drops Below $1,800: What Happened in the Last 24 Hours
ETH traded at $1,802.22 at the time of the research snapshot, hovering just above the $1,800 mark after dipping below it during intraday trading. CoinMarketCap’s data showed a 24-hour range of $1,779.64 to $1,824.98, confirming that the token breached the round number before partially recovering.
The verified 24-hour decline stood at -1.09%, supporting a meaningful daily loss though not the exact -1.23% figure cited in some initial reports. According to an unconfirmed headline tip, ETH was down exactly 1.23%, but direct API checks could not replicate that precise figure.

Why $1,800 Is a Psychological Marker
Round-number price levels attract concentrated limit orders and stop-losses. When ETH crosses below $1,800, it triggers automated selling from traders who placed stops at that level, which can temporarily accelerate the decline.
crypto.news reported on July 9 that ETH was trading around $1,756 after repeated failures to hold above $1,800, framing the level as a “wall” capping recovery attempts. The pattern suggests that $1,800 has transitioned from support to contested resistance over recent sessions.
Why ETH Price Is Under Pressure Today
Broader Market Sentiment
The crypto Fear and Greed Index printed a score of 26, classified as “Fear.” That reading reflects cautious positioning across the digital asset space, not just within Ethereum markets. Similar risk-off conditions have previously accompanied Bitcoin falling below key psychological levels as well.
Technical Breakdown Dynamics
ETH’s 24-hour trading volume reached $6.41 billion, indicating active participation in the selloff rather than a low-liquidity drift. When volume accompanies a break below support, it typically signals conviction behind the move rather than a temporary wick.
The market cap stood at $217.5 billion at the time of snapshot, placing Ethereum firmly as the second-largest cryptocurrency but reflecting sustained underperformance relative to its 2024 highs.
Trader Positioning
General U.S. regulatory uncertainty continues to weigh on sentiment as an overhang, according to recent market commentary. No single Ethereum-specific catalyst drove this particular decline; instead, the move appears to reflect cumulative positioning pressure in a risk-off environment.
Key ETH Levels to Watch After the $1,800 Breakdown
Support Below $1,800
The intraday low of $1,779.64 establishes the nearest tested support. Below that, the $1,750 zone has drawn attention from analysts, with crypto.news highlighting it as a level where ETH found temporary footing during a prior dip to $1,756.
A sustained break below $1,750 would expose ETH to further downside, potentially toward the $1,700 area where prior consolidation occurred. Similar cascading breakdowns have triggered significant liquidation events in Bitcoin markets when key levels gave way.
Resistance on Any Bounce
The $1,800 level now functions as overhead resistance. The intraday high of $1,824.98 marks where sellers stepped in during the session, creating a narrow resistance band between $1,800 and $1,825.
For bulls to reclaim momentum, ETH would need to close decisively above $1,825 on meaningful volume, flipping the former support zone back into a base for further recovery.
What Would Signal Stabilization
A daily close above $1,800 combined with declining selling volume would suggest the breakdown was a false signal. Conversely, consecutive daily closes below $1,780 with rising volume would confirm the bearish break and likely attract further short interest.
What the Move Means for Ethereum Market Sentiment
ETH as an Altcoin Bellwether
Ethereum weakness near psychologically important levels tends to suppress confidence across the broader altcoin market. When ETH struggles, traders often reduce exposure to higher-beta tokens that typically correlate with Ethereum’s directional moves.
CoinDesk reported in early June that ETH falling below $1,800 coincided with broader market weakness, including paper losses approaching $9 billion for at least one large institutional holder. That context reinforces how ETH’s price trajectory carries outsized weight for overall crypto market structure.
Near-Term Ethereum Narrative
Despite the 7-day performance showing a modest 2% gain according to CoinGecko data, the inability to hold above $1,800 on multiple attempts suggests weakening conviction among short-term holders. The current Fear reading of 26 aligns with a market that has not yet found a catalyst to reverse the cautious tone.
Upcoming network developments and broader macro conditions will likely determine whether ETH can reclaim the $1,800 level. Until then, the token remains in a range where leveraged positions on major exchanges face elevated risk of forced closure on either side of the trade.
FAQ About Ether Falling Below $1,800
What caused ETH to fall below $1,800?
No single catalyst triggered the decline. The move reflects broader risk-off sentiment across crypto markets, with the Fear and Greed Index at 26 and repeated failures to sustain prices above the $1,800 resistance zone over recent sessions.
Is $1,800 still an important level for Ethereum?
Yes. The $1,800 threshold has functioned as both support and resistance in recent weeks. Multiple data sources confirmed ETH oscillating around this level, with the token touching $1,779 on the low end and $1,825 on the high end within a single 24-hour period.
What should traders watch after a 1% daily decline in ETH?
Key levels include $1,750 as downside support and $1,825 as the nearest resistance. Volume trends and consecutive daily closes relative to $1,800 will indicate whether this is a temporary dip or the start of a deeper correction. The broader crypto market’s reaction to similar round-number breaks can also provide directional context.
Disclaimer: This article is for informational purposes only and does not constitute financial or investment advice. Cryptocurrency and digital asset markets carry significant risk. Always do your own research before making decisions.

