







BTC Price at $61,359 Could Trigger $667M in Long Liquidations: CEX Data
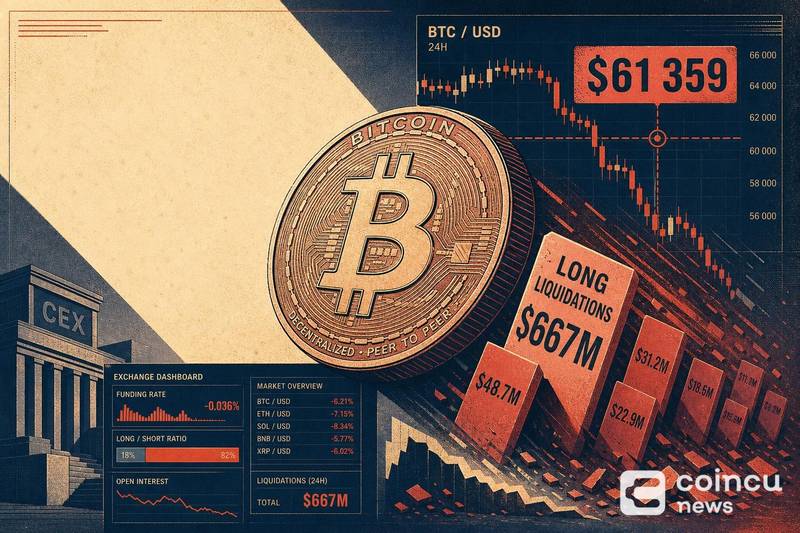
Bitcoin faces a concentrated pocket of downside risk near $61,359, where cumulative long liquidation intensity across mainstream centralized exchanges is projected to reach roughly $667 million if the price breaks below that level, according to derivatives liquidation data. The figure marks that price zone as a key pressure point for leveraged BTC long positions.
BTC Near $61,359: Why This Price Level Matters
The $61,359 mark stands out because it sits directly beneath a dense band of leveraged long positions. Should BTC fall through it, the cumulative long liquidation intensity on major exchanges is estimated at about $667 million, based on liquidation data. For related coverage, see Major CEX Long Liquidations May Hit $1.56B if BTC Drops Below $60,785.
The scope of that estimate is limited to mainstream centralized exchanges, where most leveraged BTC futures activity is concentrated. That framing keeps the signal specific to Bitcoin rather than the broader crypto market. For related coverage, see T. Rowe Price launches actively managed multi-token spot ETF.
Liquidation intensity does not measure realized losses; it maps where forced closures would cluster if price reaches a given level. The $61,359 threshold is therefore a projected trigger, not a confirmed event. For related coverage, see CoWSwap Whale Transfers 528.2 ETH After Long Accumulation Period.
How Long Liquidations Can Accelerate a BTC Sell-Off
Leveraged longs are most vulnerable when price falls into crowded zones where many positions share similar liquidation prices. Once BTC trades into that band, the forced liquidation mechanism closes those positions at market. For related coverage, see DOG Mode Relaxes Bitcoin Forwarding Policy Without Changing Consensus Rules.
Because forced closures of longs are executed as sells, they can add supply into a falling market. When enough positions sit at nearby levels, that creates cascade risk, where each round of liquidations pushes price toward the next cluster and amplifies short-term volatility. For related coverage, see Binance Wallet Adds Multiple Launchpad Filters for Robinhood Chain.
What the $667M Cluster Suggests About Positioning
A liquidation cluster of this size points to crowded long exposure sitting just above the threshold. Concentration across mainstream CEXs indicates the positioning is broad rather than confined to a single venue.
Read as a positioning signal, the data reflects how fragile market sentiment can become near support: a shared liquidation price means many leveraged traders would be squeezed at once. This is a measure of support vulnerability, not a forecast that BTC will reach the level.
A similar pattern has appeared at lower thresholds, with data showing that long liquidations could reach $1.56 billion if BTC drops below $60,785, underscoring how liquidation intensity stacks up across nearby price zones.
Signals Traders May Watch Next
The immediate focus is BTC’s reaction at $61,359. A brief wick below the level carries less weight than sustained follow-through selling, which would confirm that the liquidation band is actually being triggered.
Traders typically pair liquidation maps with open interest and funding rates to gauge whether leverage is building or unwinding. Rising open interest into the level with elevated funding would signal more crowded longs; a rebound with cooling funding would suggest the risk is easing.
FAQ
What is a BTC long liquidation?
A long liquidation occurs when a leveraged position betting on higher prices is force-closed by an exchange because the trader’s margin can no longer support the losing position. The exchange sells the position at market to cover the shortfall.
Why is $61,359 important?
It is the level below which liquidation data projects cumulative long liquidation intensity of about $667 million on mainstream CEXs, making it a concentrated zone of downside risk for leveraged longs.
Does $667 million in liquidation intensity guarantee a crash?
No. Liquidation intensity maps where forced selling would cluster if price reaches the level; it does not predict that BTC will fall there or that a cascade will follow. It is a positioning signal, not a price forecast.
Additional source references: source document 1.
Disclaimer: This article is for informational purposes only and does not constitute financial or investment advice. Cryptocurrency and digital asset markets carry significant risk. Always do your own research before making decisions.
No tags available.


Other Posts








- China, US Conclude Trade Talks with Focus on Cooperation
- Crypto Weekly: NYSE Backs OKX, Kraken Gets Fed Access, BTC Sells
- Court Upholds Fed’s Rejection of Custodia Bank’s Request
- Former CFO Convicted for $35M Fraudulent Crypto Investment
- DeriW Launches Edge Hour Trading Competition Platform for Derivatives Traders
- Michael Saylor Denies Bitcoin Sell-Off Amid Large BTC Transfer
- Buy Dogecoin on eToro: Step-by-Step Guide for Beginners (2024)
- Kazakhstan Explores Crypto Reserves Backed by National Funds
- JPMorgan Increases Holdings in BlackRock’s Bitcoin ETF
- Nordea Bank Introduces Bitcoin ETP Trading for Nordic Customers
- XRP Spot ETF Launches on Nasdaq Amid Market Fluctuations
- Peter Schiff Challenges Michael Saylor on MSTR’s Business Model
- Thailand Orders Worldcoin to Delete 1.2 Million Biometric Records
- UK Proposes New DeFi Tax Framework to Ease User Burden
- WLFI Under Fire: Analyst Warns Hyperliquid Could Be Next
- Ancient Ethereum Whale Moves $1.19 Billion After Decade
- BlackRock Receives Large Crypto Transfers from Coinbase
- SEC Scrutiny on ALT5 Sigma’s Leadership Disclosure Timing
- Yala Injects $5.5 Million Amid Recovery Efforts
- Radiant Capital Faces $50M Loss in Major Security Breach
- China, US Conclude Trade Talks with Focus on Cooperation
- Crypto Weekly: NYSE Backs OKX, Kraken Gets Fed Access, BTC Sells
- Court Upholds Fed’s Rejection of Custodia Bank’s Request
- Former CFO Convicted for $35M Fraudulent Crypto Investment
- DeriW Launches Edge Hour Trading Competition Platform for Derivatives Traders
- Michael Saylor Denies Bitcoin Sell-Off Amid Large BTC Transfer
- Buy Dogecoin on eToro: Step-by-Step Guide for Beginners (2024)
- Kazakhstan Explores Crypto Reserves Backed by National Funds
- JPMorgan Increases Holdings in BlackRock’s Bitcoin ETF
- Nordea Bank Introduces Bitcoin ETP Trading for Nordic Customers
- XRP Spot ETF Launches on Nasdaq Amid Market Fluctuations
- Peter Schiff Challenges Michael Saylor on MSTR’s Business Model
- Thailand Orders Worldcoin to Delete 1.2 Million Biometric Records
- UK Proposes New DeFi Tax Framework to Ease User Burden
- WLFI Under Fire: Analyst Warns Hyperliquid Could Be Next
- Ancient Ethereum Whale Moves $1.19 Billion After Decade
- BlackRock Receives Large Crypto Transfers from Coinbase
- SEC Scrutiny on ALT5 Sigma’s Leadership Disclosure Timing
- Yala Injects $5.5 Million Amid Recovery Efforts
- Radiant Capital Faces $50M Loss in Major Security Breach
- China, US Conclude Trade Talks with Focus on Cooperation
- Crypto Weekly: NYSE Backs OKX, Kraken Gets Fed Access, BTC Sells
- Court Upholds Fed’s Rejection of Custodia Bank’s Request
- Former CFO Convicted for $35M Fraudulent Crypto Investment
- DeriW Launches Edge Hour Trading Competition Platform for Derivatives Traders
- Michael Saylor Denies Bitcoin Sell-Off Amid Large BTC Transfer
- Buy Dogecoin on eToro: Step-by-Step Guide for Beginners (2024)
- Kazakhstan Explores Crypto Reserves Backed by National Funds
- JPMorgan Increases Holdings in BlackRock’s Bitcoin ETF
- Nordea Bank Introduces Bitcoin ETP Trading for Nordic Customers
- XRP Spot ETF Launches on Nasdaq Amid Market Fluctuations
- Peter Schiff Challenges Michael Saylor on MSTR’s Business Model
- Thailand Orders Worldcoin to Delete 1.2 Million Biometric Records
- UK Proposes New DeFi Tax Framework to Ease User Burden
- WLFI Under Fire: Analyst Warns Hyperliquid Could Be Next
- Ancient Ethereum Whale Moves $1.19 Billion After Decade
- BlackRock Receives Large Crypto Transfers from Coinbase
- SEC Scrutiny on ALT5 Sigma’s Leadership Disclosure Timing
- Yala Injects $5.5 Million Amid Recovery Efforts
- Radiant Capital Faces $50M Loss in Major Security Breach

T. Rowe Price Includes Memecoins in Its Crypto ETF: Why It Matters

Senate Opens First Vote on Crypto Clarity Act, Delays Final Push

Exploit Drains Bitcoin Lightning Payment Servers: What Happened
Bybit Sues North Korea and Lazarus Group, Secures Preliminary Injunction Freezing Stolen Assets in Landmark Crypto Asset Recovery Effort

Spindex’s Real-Time Data Pipeline Surpasses 150 Million Tracked Gaming Events