







Bitcoin Holds Steady as ETF Inflows Offset Selling Ahead of U.S. Inflation Data
Bitcoin is holding steady as inflows into U.S. spot exchange-traded funds offset ongoing selling pressure, leaving the price range-bound while traders wait for the next U.S. inflation reading to set direction.
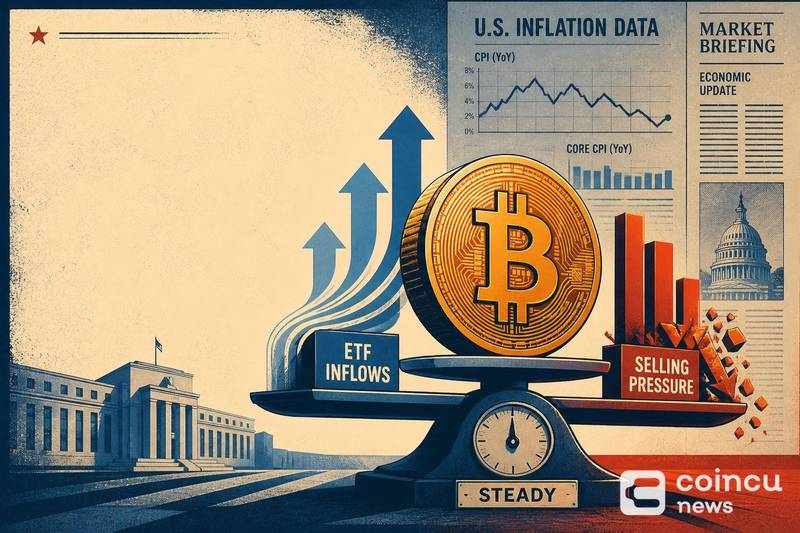
The market’s calm reflects a balance rather than a breakout. Steady ETF demand has been absorbing the coins that sellers are putting on the market, keeping Bitcoin from either a sharp rally or a decisive breakdown, according to reporting from CoinDesk. For related coverage, see U.S. XRP Spot ETFs See $7.44M Daily Net Inflows as Demand Holds.
The working explanation is straightforward: buy-side flows through the ETF wrapper are matching sell-side flows elsewhere, so price stays put. That balance, not a directional conviction trade, is the central observation right now. For related coverage, see U.S. Spot Bitcoin ETFs Record Nearly $86M in Single-Day Net Inflows.
What ETF inflows signal for short-term Bitcoin demand
Persistent inflows into the spot funds are a demand signal that can quietly soak up selling. Daily net flow figures are tracked publicly on Farside’s ETF flow dashboard. For related coverage, see U.S. Spot XRP ETFs Add $6.55M in One-Day Net Inflows.
Demand of this kind does not guarantee a higher price. Inflows can offset selling and hold the market flat without immediately producing a rally, which is what appears to be happening now. For related coverage, see Bitcoin Falls Below $80,000 Amid Tariff Jitters.
The pattern is consistent with recent flow trends, as U.S. spot Bitcoin funds have continued to draw money even in choppy conditions. Coincu earlier reported that Bitcoin ETFs recorded net inflows for the week as demand held, and separately noted nearly $86 million in single-day net inflows in an earlier session.
Why U.S. inflation data is the next catalyst for BTC
The event traders are positioning around is the upcoming U.S. Consumer Price Index release, whose timing is set by the U.S. Bureau of Labor Statistics schedule.
Ahead of major inflation prints, market participants often hold back on directional bets, which can compress ranges and mute volatility until the number lands. That waiting posture helps explain the current stasis.
A surprise in either direction could break the stalemate. Softer or hotter inflation than expected has the potential to spark a move once the data is public, though the direction of any reaction is not something the current evidence can predict.
Key market signals to watch after the inflation release
The clearest confirmation of whether the ETF-versus-selling balance is shifting will come from the market itself. The Bitcoin spot market reaction is the first thing to watch.
- Price reaction: whether BTC holds its range or breaks out after the inflation data.
- ETF flow direction: whether daily net inflows continue or flip to outflows.
- Trading volume: whether activity expands to confirm any move.
A shift toward outflows would remove the demand that has been cushioning the market. For context on how quickly conditions can turn, Coincu previously covered a stretch when Bitcoin fell below $80,000 amid ETF outflows.
FAQ
Why doesn’t Bitcoin rise if ETFs are seeing inflows?
Inflows can be offset by selling elsewhere in the market. When the two roughly match, buying absorbs the supply without pushing price higher, which keeps Bitcoin range-bound rather than rallying.
Why does U.S. inflation data move Bitcoin?
Inflation readings shape expectations for monetary policy and risk appetite, so traders often wait for the CPI print before committing to a direction, and a surprise can trigger volatility across crypto markets.
Disclaimer: This article is for informational purposes only and does not constitute financial or investment advice. Cryptocurrency and digital asset markets carry significant risk. Always do your own research before making decisions.
No tags available.


Other Posts








- China, US Conclude Trade Talks with Focus on Cooperation
- Crypto Weekly: NYSE Backs OKX, Kraken Gets Fed Access, BTC Sells
- Court Upholds Fed’s Rejection of Custodia Bank’s Request
- Former CFO Convicted for $35M Fraudulent Crypto Investment
- DeriW Launches Edge Hour Trading Competition Platform for Derivatives Traders
- Michael Saylor Denies Bitcoin Sell-Off Amid Large BTC Transfer
- Buy Dogecoin on eToro: Step-by-Step Guide for Beginners (2024)
- Kazakhstan Explores Crypto Reserves Backed by National Funds
- JPMorgan Increases Holdings in BlackRock’s Bitcoin ETF
- Nordea Bank Introduces Bitcoin ETP Trading for Nordic Customers
- XRP Spot ETF Launches on Nasdaq Amid Market Fluctuations
- Peter Schiff Challenges Michael Saylor on MSTR’s Business Model
- Thailand Orders Worldcoin to Delete 1.2 Million Biometric Records
- UK Proposes New DeFi Tax Framework to Ease User Burden
- WLFI Under Fire: Analyst Warns Hyperliquid Could Be Next
- Ancient Ethereum Whale Moves $1.19 Billion After Decade
- BlackRock Receives Large Crypto Transfers from Coinbase
- SEC Scrutiny on ALT5 Sigma’s Leadership Disclosure Timing
- Yala Injects $5.5 Million Amid Recovery Efforts
- Radiant Capital Faces $50M Loss in Major Security Breach
- China, US Conclude Trade Talks with Focus on Cooperation
- Crypto Weekly: NYSE Backs OKX, Kraken Gets Fed Access, BTC Sells
- Court Upholds Fed’s Rejection of Custodia Bank’s Request
- Former CFO Convicted for $35M Fraudulent Crypto Investment
- DeriW Launches Edge Hour Trading Competition Platform for Derivatives Traders
- Michael Saylor Denies Bitcoin Sell-Off Amid Large BTC Transfer
- Buy Dogecoin on eToro: Step-by-Step Guide for Beginners (2024)
- Kazakhstan Explores Crypto Reserves Backed by National Funds
- JPMorgan Increases Holdings in BlackRock’s Bitcoin ETF
- Nordea Bank Introduces Bitcoin ETP Trading for Nordic Customers
- XRP Spot ETF Launches on Nasdaq Amid Market Fluctuations
- Peter Schiff Challenges Michael Saylor on MSTR’s Business Model
- Thailand Orders Worldcoin to Delete 1.2 Million Biometric Records
- UK Proposes New DeFi Tax Framework to Ease User Burden
- WLFI Under Fire: Analyst Warns Hyperliquid Could Be Next
- Ancient Ethereum Whale Moves $1.19 Billion After Decade
- BlackRock Receives Large Crypto Transfers from Coinbase
- SEC Scrutiny on ALT5 Sigma’s Leadership Disclosure Timing
- Yala Injects $5.5 Million Amid Recovery Efforts
- Radiant Capital Faces $50M Loss in Major Security Breach
- China, US Conclude Trade Talks with Focus on Cooperation
- Crypto Weekly: NYSE Backs OKX, Kraken Gets Fed Access, BTC Sells
- Court Upholds Fed’s Rejection of Custodia Bank’s Request
- Former CFO Convicted for $35M Fraudulent Crypto Investment
- DeriW Launches Edge Hour Trading Competition Platform for Derivatives Traders
- Michael Saylor Denies Bitcoin Sell-Off Amid Large BTC Transfer
- Buy Dogecoin on eToro: Step-by-Step Guide for Beginners (2024)
- Kazakhstan Explores Crypto Reserves Backed by National Funds
- JPMorgan Increases Holdings in BlackRock’s Bitcoin ETF
- Nordea Bank Introduces Bitcoin ETP Trading for Nordic Customers
- XRP Spot ETF Launches on Nasdaq Amid Market Fluctuations
- Peter Schiff Challenges Michael Saylor on MSTR’s Business Model
- Thailand Orders Worldcoin to Delete 1.2 Million Biometric Records
- UK Proposes New DeFi Tax Framework to Ease User Burden
- WLFI Under Fire: Analyst Warns Hyperliquid Could Be Next
- Ancient Ethereum Whale Moves $1.19 Billion After Decade
- BlackRock Receives Large Crypto Transfers from Coinbase
- SEC Scrutiny on ALT5 Sigma’s Leadership Disclosure Timing
- Yala Injects $5.5 Million Amid Recovery Efforts
- Radiant Capital Faces $50M Loss in Major Security Breach

Bitcoin Holds Steady as ETF Inflows Offset Selling Ahead of U.S. Inflation Data


ForumPay Expands Payment Infrastructure with New Card and Bank Transfer Acceptance Solution

Newest Assets, Improved User Promotions & Much Greater Crypto Experience_ Xxkk Trade Exchange Reinforces Its Trade Environment